

In an organization, people need to make use of different tools for completing various objectives like management of the project, development of the products, tracking of the tasks, business reporting and visualizations, etc. Being able to integrate such tools not only allows them to consolidate all the data in one place but also obtain insights from it for better business decisions. The integration between Tableau and JIRA is one such example. In this article, we will understand how to connect JIRA to Tableau with a step-by-step process. Along with it, we will also go through a brief introduction about JIRA and Tableau and their importance. It will also showcase some of the use cases that can be implemented using the integration of JIRA and Tableau.
Table of contents
- What Are Tableau and JIRA?
- Why Do We Need Integration Between Tableau and JIRA?
- Best JIRA to Tableau Connector
- How to Connect JIRA to Tableau in 4 Steps
- Jira and Tableau Common Use Cases
- Conclusion
What Are Tableau and JIRA?
JIRA is a product by Atlassian that is used for the management of the project and product, tracking of the bugs and issues, etc. It acts as a central platform for the users to manage and track their releases and sprints, track the bugs and stories, collaborate with the other departments of the organization, customize workflows, and reporting, etc. It allows the users to have better management over the project, and pick out the blockers and delays to prioritize and escalate them respectively. It is one of the widely used products for implementing the agile methodology process and for CI/CD implementation. It provides integration with a lot of products used in different segments that can be viewed in the Atlassian marketplace.
Tableau is a business intelligence tool that helps in visualizing the data and performing analysis over the data using visual dashboards. It assists in creating dashboards and visualizations using the drag and drop feature, generates automated reports, and connects to the databases as live connections for real-time analysis, etc. It allows connectivity with many other software and databases for integrating the data and visualizing the same. It provides a different range of products depending upon the use cases of the customers. Some of these products are Tableau Desktop, Tableau Server, Tableau Public, Tableau Prep, etc.

Advantages of Using Tableau
It simplifies the creation of the visualizations and dashboards using the drag-and-drop feature. This allows the non-technical people to be easily familiar with the usage of the application.
It provides support for viewing and managing the dashboards and visualizations via mobile as well.
It provides a high number of different visualizations like pie charts, bar graphs, treemaps, etc that helps in analyzing the data in a different manner and provide better insights from it.
Advantages of Using JIRA
It can be integrated with over hundreds of applications that are used for different purposes. Many integrate JIRA with applications like Jenkins, GitHub, Tableau, Microsoft Teams, Slack, etc.
It offers a high degree of customization for a better user experience. We can customize workflows according to the requirements of the customers. We can also use custom fields or such elements while creating issues in the sprint.
It supports the creation of the backlogs for the organization of multiple sprints as well as can create a roadmap for planning future development and tasks spanning over months of time.
Why Do We Need Integration Between Tableau and JIRA?
Tableau and JIRA are one of the top players in their segments. They provide great value to their customers by satisfying their needs and a great user experience. The integration of Tableau and JIRA can help the organization in analyzing and visualizing the JIRA data in a seamless manner. It can help analyze the number of issues and bugs getting created for a certain period of time, track the project speed and delays, if any, visually, check the number of issues in each phase of the workflow, the number of issues completed, etc. This allows the organizations to better manage the resources, provide an overview of the ongoing projects, etc.
The JIRA and Tableau connection does not come as an in-built feature in the applications. One of the ways to integrate JIRA and Tableau is via connectors. The connectors are an easy-to-setup and reliable way to connect to JIRA. Although, there are some connectors available at the Atlassian marketplace that connect to JIRA directly without importing its data. This can create a dependency upon the usage of the connector as it would try connecting to JIRA each time we need to query data. Some connectors connect to the JIRA software and load the data into a data warehouse. Then, we can use Tableau to connect through that data warehouse ultimately gaining access to the JIRA data. This removes the dependency on the connector and thus the data can be easily loaded from the data warehouse.
Best JIRA to Tableau Connector
Skyvia is a tool that can be used to connect JIRA to Tableau with little effort. Skyvia is a code free solution, which requires from users minimum technical knowledge.
There are, of course, quite a lot of other data integration tools on the market, but most are either too complex and require a lot of technical knowledge or cover only specific use cases and capitulate to slightly different business needs.
In this respect, Skyvia offers both a number of simpler tools for simpler use cases and advanced solutions for complex scenarios. Each requires no coding knowledge and can be configured visually. Let us consider below the Jira-Tableau data integration scenario.
How to Connect JIRA to Tableau in 4 Steps
If you need to analyze data stored in Jira through a tool like Tableau, you can use Skyvia for this purpose. With Skyvia it is quite easy to perform. First, you need to replicate necessary data from Jira to the database or data warehouse. Second, you need to access this database from Tableau and create reports. You can find a step-by-step brief instruction on how to do it below.
STEP 1: SIGN UP TO SKYVIA TO START
To sign up to Skyvia, use this link. Skyvia has a free plan that allows loading up to 5k records per month between data sources. It allows running automatically two data integration operations once per day. This plan user receives automatically when signing up to Skyvia. Information on other plans available in Skyvia can be found on the pricing page.

STEP 2: CREATE CONNECTION TO JIRA AND DATABASE/DWH
We need to create connections both to Jira and to the database in Skyvia. For this, we click New, then Connection in the menu on the left.
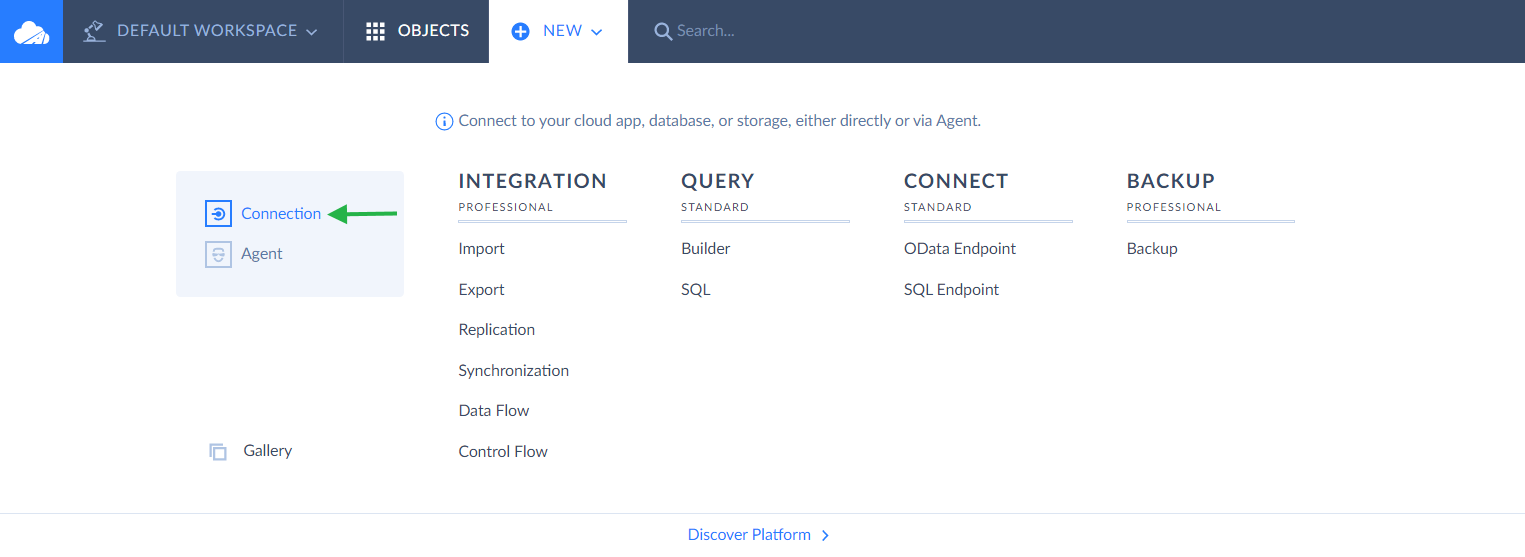
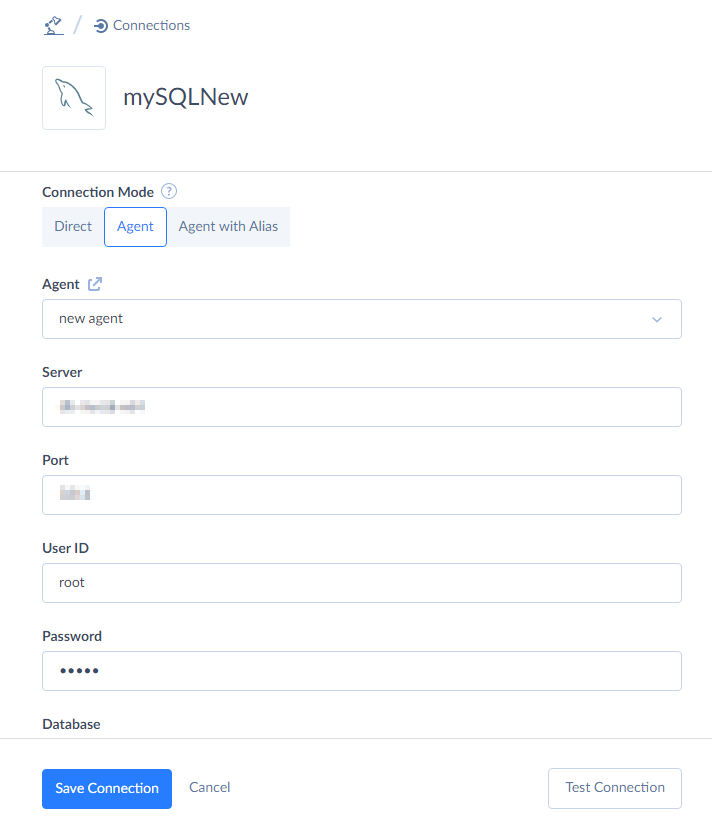
This will take us to the list of Skyvia connectors. First, we create a connection to JIRA. Second, we create a connection to MySQL. MySQL will serve as a database to copy JIRA data to.
STEP 3: COPY JIRA DATA TO MYSQL (OR ANY OTHER DATABASE) FOR A FURTHER DATA ANALYSIS IN TABLEAU
The scenario of copying JIRA data to a databse or DWH can be implemented in Skyvia with the help of the Replication package. Why exactly a replication? Replication can be a perfect option when you need to move your data from a cloud app to a database for storage and analysis. Skyvia replication operation is intended to create a copy of cloud app data in a relational database or cloud data warehouse and keep it up-to-date. You can read more about it here.
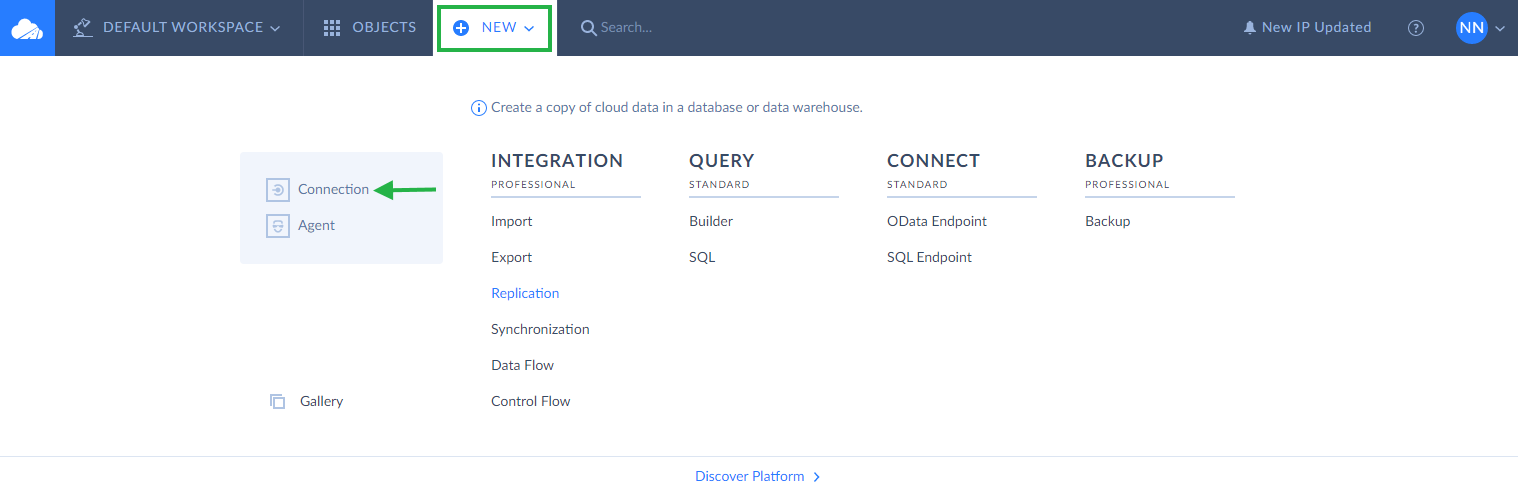
To create a Replication package, click New, then under the Integration header, click Replication.
In the Replication package, we select JIRA as source connection, MySQL as target connection, select necessary JIRA objects to replicate and additional options available in the package. Then we click Validate.
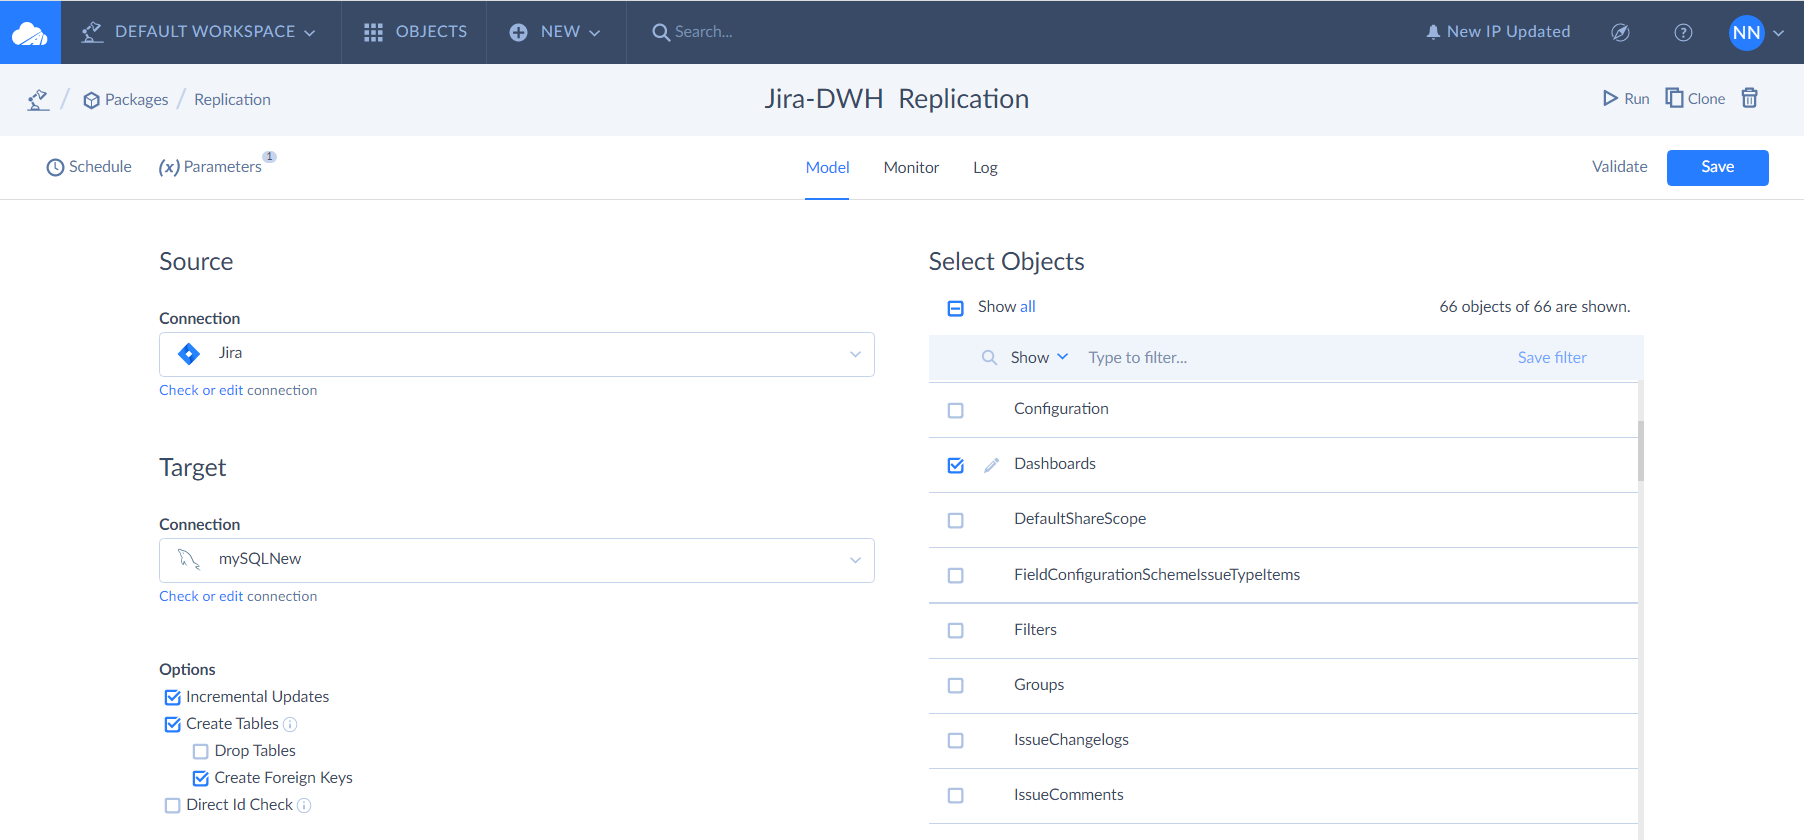
We give Skyvia a few seconds to make sure everything is running as expected and we should see a popup message saying ‘The package is valid’. Then we click Create or Save. Once this is saved, we can click Run to run the first sync and make sure everything is running as expected! This article also contains information about Replication.
Alternative to Replication
Another option is to use Skyvia Connect instead of Replication. What is important to know about Skyvia Connect? Skyvia Connect allows exposing data from various sources via the OData protocol and makes it available in JSON or XML format over the web. This endpoint can be accessed from Tableau.
However, we should pay attention to such Tableau peculiarities: Tableau does not support OData in the JSON format. Skyvia uses the ATOM format by default for ODATA v1-3. So you can use only v1-3 Skyvia endpoints in Tableau and you also need to specify EntitySet at the end of the link. More information about the Skyvia Connect can be found here.
STEP 4: ACCESS THE DATABASE FROM TABLEAU AND CREATE REPORTS
After copying the data to the database (in our case, it is MySQL), we access MySQL from Tableau and create necessary reports. This step we perform in the Tableau interface itself. We need to log in to Tableau, to create and work with reports.
Jira and Tableau Common Use Cases
By integrating JIRA and Tableau, a variety of dashboards can be prepared based on the use-cases and the requirements of the organization. The data obtained from JIRA can provide insights into different aspects of the projects and the resources involved. Following are the use-cases that can be applied by integrating Tableau and JIRA:
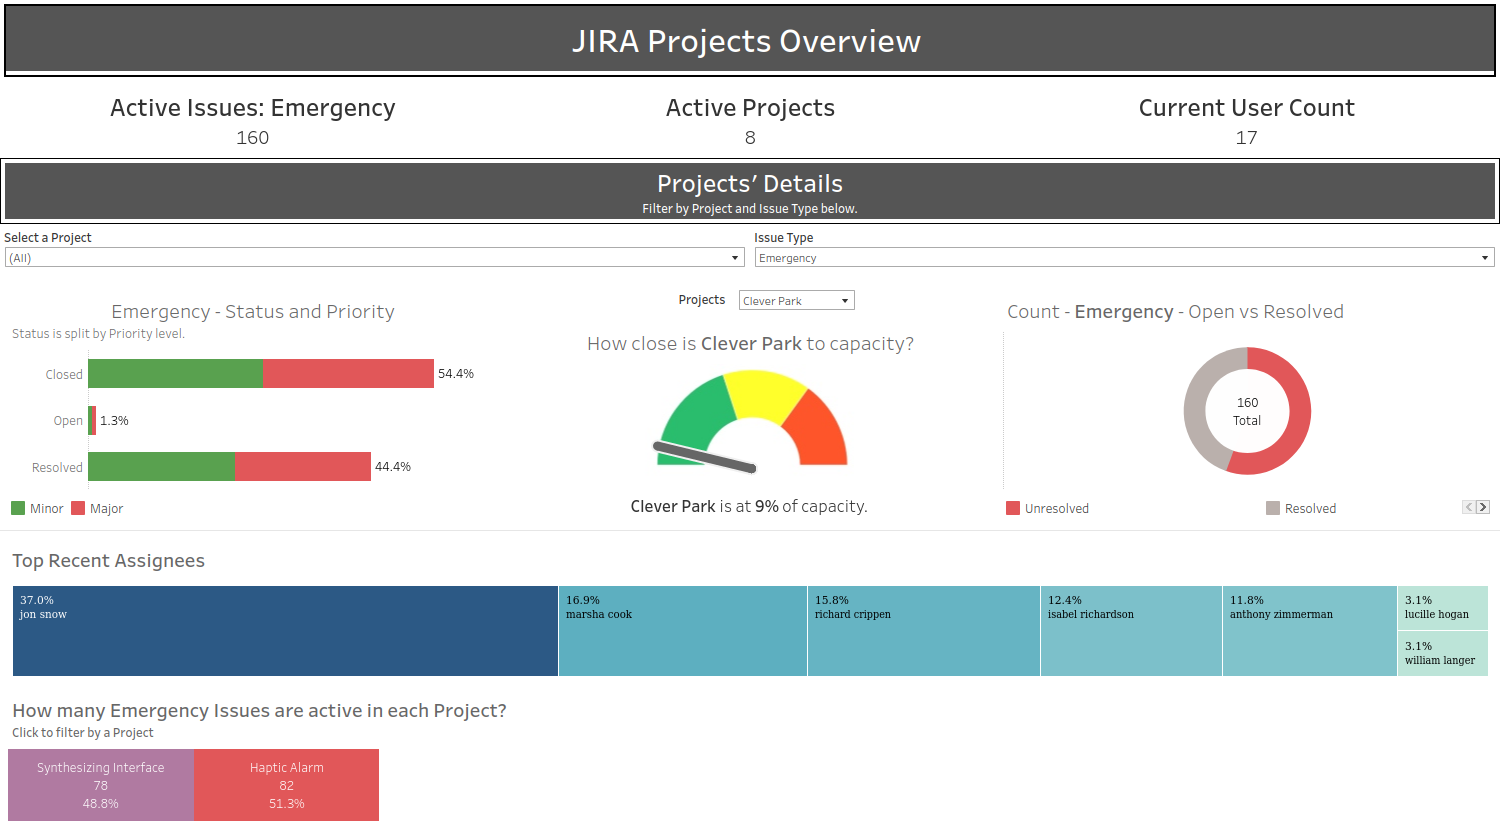
- Overview of the Ongoing Projects
For the management team, it is very important to know the status of the ongoing projects. It allows them to showcase the progress of the project to the stakeholders using visualizations that are easy to understand. If there are any delays in the resolution of the bugs and issues, those can be prioritized. The below dashboard shows an overview of all the ongoing projects.
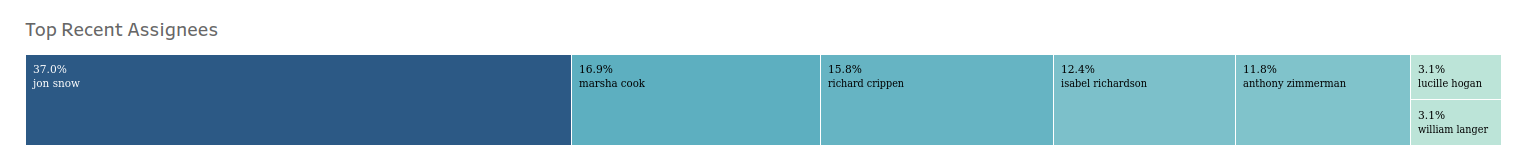
- Better Resource Management
We can create a visualization for viewing the number of issues that have been solved by certain resources. This allows us to monitor the performance of the resources as well as to manage the resources within different projects. This can ensure that resources are not overloaded with the tasks at hand and are able to complete them before the due date. The below visualization shows the percentage of the total issues allotted to the resources. These statistics can also be observed over a period of time for better insights.
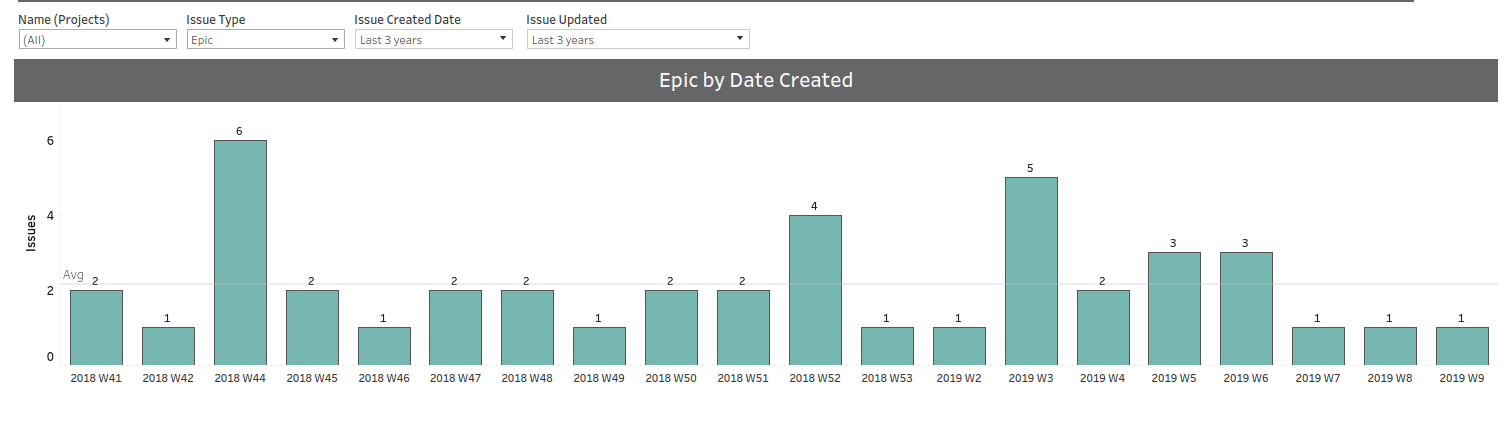
- Tracking the Course of the Projects over a Period of Time
By observing the number of issues that have been created in a certain project, the management team can showcase the progress of the project to the stakeholders. Some visualizations can also be created to see the number of issues that have been delayed as well the number of issues that have been completed before the due date. This would provide good insights to the management team regarding the progress of the ongoing projects. In the below image, we can see the number of epics that have been created over the course of three years for all the projects.
- Daily Reporting and Visualizations
The dashboards can be created to visualize the daily progress of the ongoing projects and can be reported to the concerned stakeholders on a daily basis. These Visualizations can help the managers in tracking the status of the projects which ultimately ensures the timely completion of the tasks in the project and avoid the risk of any escalations in the near future. - Tracking the Sprints and Issues of the Projects
The tasks that are created in each of the sprints can be tracked by creating visualizations over them. The number of tasks that were completed, delayed, or are in progress can also be visualized. This not only ensures better management of the sprints but also provides tracking of the issues that might come up related to one of these tasks after the release. - Monitor the Performance of the Resources
Each task that is created in JIRA is generally assigned to someone who will be responsible for its completion. The number of tasks assigned to each of the resources over time can be tracked and whether those tasks were completed, or are delayed. Such metrics can help in analyzing the performance of the resources and can also help in managing the workload of the resources.
Conclusion
It’s imperative to make utmost use of whatever data we have at hand. It not only strengthens the collaboration between multiple teams but also ensures better confidence in making better decisions as they are supported by past data. The Tableau-JIRA integration is one such method to analyze the projects and resources. Skyvia provides a great connector to easily integrate the JIRA data into Tableau.
