

Summary
- Skyvia. A no-code cloud platform that covers ETL, ELT, reverse ETL, backup, and API management from a single interface, connecting 200+ cloud apps, databases, and file storage without writing a line of code.
- Fivetran. A fully managed ELT pipeline service that automates data movement from source to warehouse with minimal configuration, built for teams that want reliable connectors and zero pipeline maintenance.
- Talend. A data integration platform with a broad feature set for collection, transformation, and pipeline design, suited for organizations that want flexibility across cloud, on-premises, and hybrid environments.
- Airbyte. An open-source ELT platform with a rapidly growing connector library, popular with engineering teams that want self-hosted control over their pipelines and the option to build custom connectors.
- Snowflake. A cloud-native data warehouse built for scale, designed to separate storage from compute so teams can run complex analytics across massive datasets without managing infrastructure.
At Skyvia, while building data integration software for a living, we’ve spent years watching pipelines break, schemas drift, and “quick ETL jobs” turn into six-month engineering projects.
That background means we know exactly what to look for when a tool claims it can handle your data stack.
Building a modern one isn’t about finding one platform that does everything. It rarely works that way in practice.
What actually holds up is a combination of something that:
- Moving data reliably from A to B.
- Storing and querying it at scale.
- Transforming it into a shape worth analyzing.
- Something that turns the results into decisions people can act on.
Get that combination right, and the stack runs quietly in the background while the business gets on with things. Get it wrong, and you spend more time fixing pipelines than running them.
The fifteen tools in this review cover all four layers:
- Integration.
- Storage.
- Processing.
- Visualization.
We’ve looked at each one on its own terms: what it actually does well, where it falls short, who it’s built for, and what it costs.
Skyvia is on the list too, and we’ve tried to be as straight with you about its limitations as we are about everyone else’s.
How We Tested These Tools
We didn’t evaluate these tools by reading feature lists. We put them to work.
Since these tools serve different roles in the data stack, we grouped them into four categories and evaluated each within its context:
- Data Integration
- Storage
- Processing
- Visualization
Each category was tested against criteria that reflect how teams actually use these tools in production.
Data Integration
For integration platforms like Skyvia, Fivetran, Talend, and Airbyte, we ran a controlled test: migrating a 1-million-row CSV dataset into Snowflake.
We measured:
- Setup time from zero to first successful sync
- API and configuration complexity
- Sync speed under load
- Pricing per row at scale (not just advertised plans)
- Behavior during schema changes mid-sync
This gave us a clear view of how each tool performs when moving real data. Not just small demo datasets.
Storage
For storage systems like Snowflake, BigQuery, MongoDB, and Cassandra, we focused on:
- Query performance under realistic workloads
- Scalability model (auto-scaling vs manual tuning)
- Infrastructure overhead required to operate the system
The goal here was simple: how much effort does it take to store and retrieve data reliably as it grows?
Processing
For processing engines such as Databricks, Apache Spark, and Hadoop, we evaluated:
- Performance on large-scale transformations
- Flexibility of data processing workflows
- Operational complexity and setup overhead
These tools aren’t just about speed — they’re about how easily teams can build and maintain data workflows over time.
Visualization
For tools like Tableau and Power BI, we tested:
- Connection flexibility across data sources
- Time required to build meaningful dashboards
- Performance as dataset size increases
Because in the end, data only matters if people can use it.
The Ultimate Big Data Tool Comparison
Specs sheets tell part of the story. The rest shows up when you’re three hours into a setup and realizing the “simple connector” requires a custom API wrapper. Here’s what we actually found:
| Tool | Category | Pricing Model | Sync Frequency | API Complexity | |
|---|---|---|---|---|---|
| Skyvia | Integration / Backup / API | Per package (flat monthly) | 1 min on paid plans | Visual — no code required | Cloud only |
| Fivetran | Integration / ELT | Per monthly active row | 1–5 min | Visual with some config | Cloud only |
| Talend | Integration / ETL | Per connector (license-based) | Scheduled / batch | Code-heavy for advanced flows | Cloud + On-Prem |
| Airbyte | Integration / ELT | Open-source free; Cloud per row | Custom / near real-time | Visual + code for custom connectors | Cloud + Self-hosted |
| Snowflake | Data Warehouse | Per compute credit + storage | Real-time queries | SQL-based | Cloud only |
| Google BigQuery | Data Warehouse | Per query / per storage GB | Real-time queries | SQL + API | Cloud only |
| MongoDB | NoSQL Database | Per cluster / serverless per op | Real-time | Driver / API-based | Cloud + On-Prem |
| Cassandra | NoSQL Database | Free (open-source) | Real-time writes | Code-heavy | Cloud + On-Prem |
| Databricks | Data Processing / ML | Per DBU (compute unit) | Near real-time / batch | Code-heavy (Python/SQL/Scala) | Cloud only |
| Apache Spark | Data Processing | Free (open-source) | Real-time streaming | Code-heavy | Cloud + On-Prem |
| Apache Hadoop | Data Processing | Free (open-source) | Batch only | Code-heavy | On-Prem / Cloud |
| Tableau | Visualization / BI | Per user / per role | Live or extract-based | Visual | Cloud + Desktop |
| Power BI | Visualization / BI | Per user / Premium capacity | Near real-time | Visual + some config | Cloud + Desktop |
Note:
- Pricing surprises. Fivetran’s per-active-row model looks reasonable until your datasets grow. After it, the system compounds fast. Airbyte’s open-source version is genuinely free, but self-hosting adds infrastructure overhead that has a cost of its own even if it doesn’t show up on an invoice.
“Visual” doesn’t always mean simple. Talend has a visual interface, but configuring anything beyond a basic flow requires enough technical context that calling it no-code would be generous. Tools like Skyvia sit on the friendlier end, where non-technical users can build pipelines without writing code. Power BI starts off approachable, but quickly introduces concepts like data modeling and DAX that require a more technical mindset.
1. Big Data Integration & Pipeline Tools (Extract & Load)
Skyvia — Best for SMBs & No-Code Pipelines
We’re not going to pretend we’re neutral here. Skyvia is our product. But we’ve also been running it in production long enough to know exactly where it shines and where it doesn’t, so here’s the honest version.
When we connected Salesforce to BigQuery using Skyvia’s Replication scenario, the whole setup — authentication, schema mapping, incremental update configuration, schedule — took under ten minutes.
- No code.
- No YAML files.
- No waiting for a developer to free up.
The mapping interface lets you:
- See the full picture of where the source fields are going.
- Catch mismatches before they become pipeline errors.
- Adjust without touching anything outside the browser.
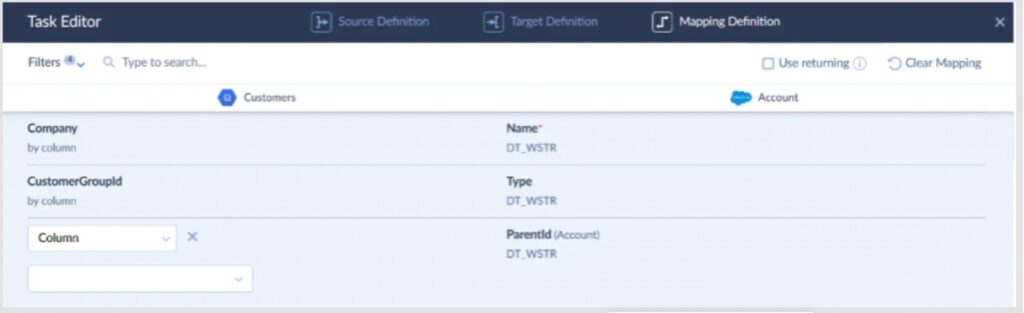
That kind of visibility matters more than most teams realize until they’ve spent an afternoon debugging a silent data loss caused by a field type mismatch nobody caught.
What it covers
Skyvia handles the full integration lifecycle from one platform: ETL and ELT pipelines, reverse ETL back into business apps, bidirectional sync, CSV import/export, workflow automation, cloud backup, OData and SQL API endpoints, and an online SQL query tool with Excel and Google Sheets add-ons. Over 200 connectors across CRMs, databases, data warehouses, file storages, and marketing platforms.
Pricing
- Free plan
- Basic from $79/month
- Standard from $159/month
- Professional from $399/month
- Enterprise at custom pricing for regulatory requirements
Flat monthly rate regardless of row count or connector volume — no surprise invoices at the end of the month when a pipeline runs hot.
Real Pro
Flat-rate pricing and a visual wizard that non-technical users can actually operate. Most no-code tools claim this; Skyvia is one of the few where a business analyst can set up and maintain a pipeline without ever pulling in engineering.
Real Con
Skyvia is cloud-native, full stop. If you’re in banking, healthcare, or any sector where data governance policy requires a strictly on-premises deployment with zero internet exposure, we’re not the right fit. Look at Talend instead — it’s built for hybrid and on-prem environments and has the compliance tooling to match.
Fivetran — Best for Enterprise Automated ELT
You pick a source, plug in credentials, choose a destination like Snowflake or BigQuery, and it just starts pulling data. The setup screen is almost suspiciously simple — connector → destination → sync frequency, and you’re live.
Here’s what a real Fivetran Connectors dashboard looks like once a few pipelines are running.
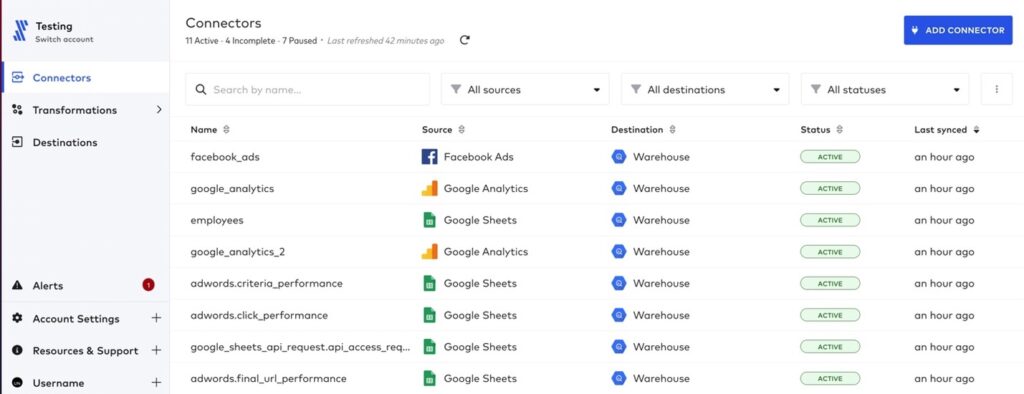
Notice what’s not there: no mapping screens, no transformation logic upfront, no schema configuration to wrestle with. Eleven connectors running, all marked ACTIVE, syncing on schedule without anyone touching them.
That’s the whole philosophy: load everything first, figure it out later.
Which is great — until you care about what’s actually landing in your warehouse.
What it covers
Fivetran is built around automated ELT.
It extracts data from SaaS apps, databases, and event sources, then loads it directly into your warehouse with minimal intervention. Schema changes are handled automatically, and incremental updates are baked in by default.
It’s especially strong when you’re dealing with:
- Large volumes of data across multiple sources.
- Standard SaaS connectors (Salesforce, HubSpot, NetSuite, etc.).
- Teams that want pipelines running without having to touch them.
Transformations typically happen downstream, often with tools like dbt.
Pricing
Fivetran uses a usage-based pricing model built around Monthly Active Rows (MAR).
In simple terms, you’re charged based on how many rows change and get processed each month.
On paper, it scales nicely. In practice, costs can ramp up quickly as your data grows or updates more frequently.
A pipeline that looks cheap in month one can look very different once your product or user base scales.
Real Pro
This is about as close as it gets to “set it and forget it.”
Once a connector is live, Fivetran handles schema changes, retries, incremental sync, and monitoring without much input. For large teams moving serious data volumes, that reliability is hard to beat.
Real Con
Pricing predictability.
Because everything is tied to data change volume, it’s not always obvious what your bill will look like next month. If tables start updating more frequently — or someone adds a high-churn source — costs can spike fast.
Also, the lack of control at ingestion means you often end up loading more data than you actually need… and paying for it.
Talend — Best for High-Volume & Hybrid Deployment
We’ve used Talend in projects where cloud-only tools just weren’t enough, especially when on-prem systems or strict compliance requirements were in play.
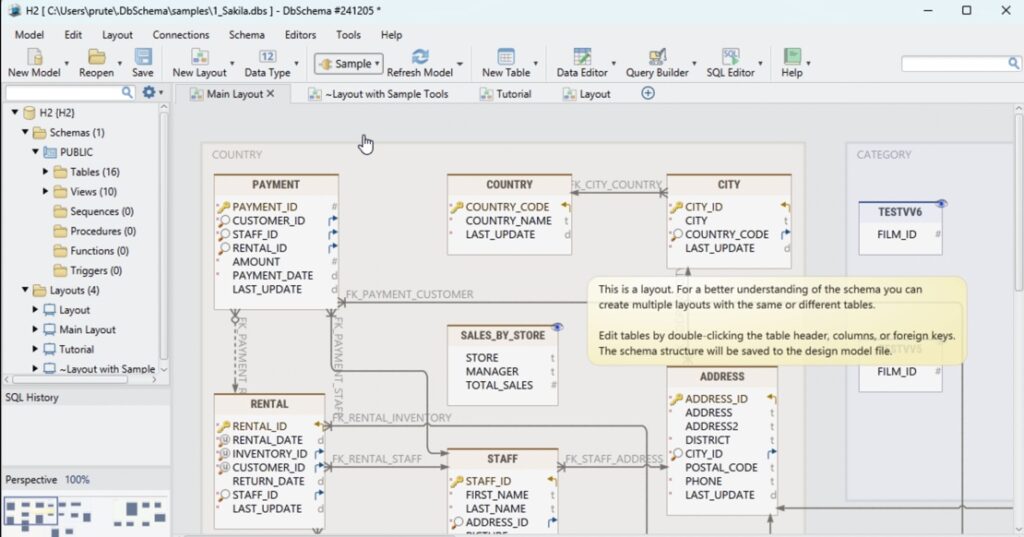
The setup experience is very different from something like Skyvia or Fivetran.
You open Talend Studio, drag components onto a canvas, wire them together, configure each step, and define how data flows through the pipeline.
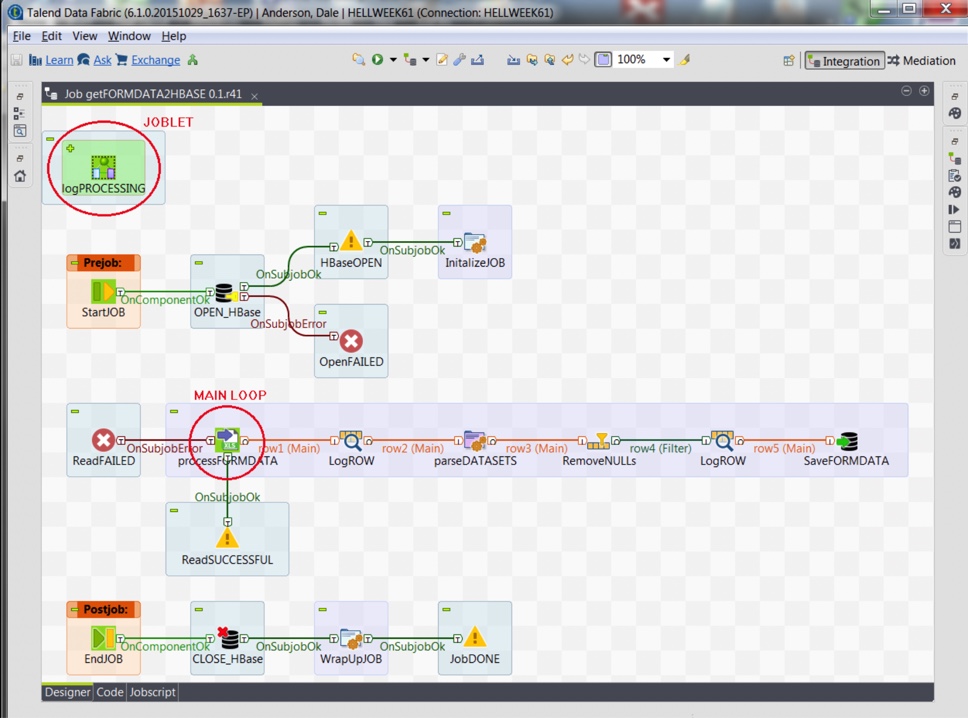
It’s powerful, but it’s not something you “just click through.” You’re building the pipeline piece by piece.
That’s the trade-off: more control, more responsibility.
What it covers
Talend is a full data integration platform, not just a pipeline tool.
It handles:
- Data integration and ETL pipelines.
- Data quality and validation.
- Data preparation and profiling.
- Batch and real-time processing.
- Hybrid deployments (cloud + on-prem).
It works well in environments where data isn’t neatly sitting in SaaS tools (think legacy systems, internal databases, and regulated infrastructure)
Pricing
Talend pricing isn’t self-serve.
You’ll need to go through sales, and pricing depends on scale, deployment model, and feature set.
In practice, it’s positioned as an enterprise solution, and the cost reflects that.
Real Pro
Control.
If you need to run complex transformations before data lands anywhere, integrate with on-prem systems, or meet strict compliance requirements, Talend gives you the flexibility to do it properly.
It’s built for environments where “just load everything and deal with it later” isn’t acceptable.
Real Con
It’s heavy.
You need developers who understand the platform. Pipelines take time to build. Maintenance is ongoing. Compared to lighter, cloud-native tools, the setup and operational overhead are significantly higher.
Airbyte — Best for Developer-Heavy Teams
G2: 4.4/5 · Capterra: no reviews
We’ve deployed Airbyte in environments where the team explicitly said: “We want full control, and we’re fine maintaining it.”
The setup starts clean. You spin it up (Docker, Kubernetes — your call), open the UI, and see a connector-based flow: source → destination → sync frequency. It feels simple at first glance.
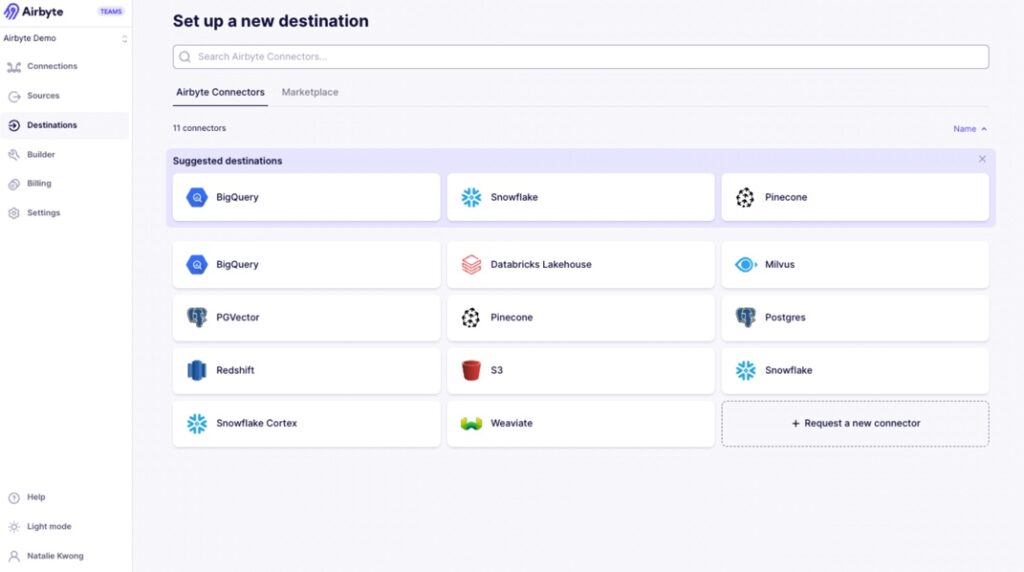
But pretty quickly, you run into the reality of the open-source model.
For example, when connecting to APIs, you often need to configure pagination, handle nested JSON responses, or tweak connector settings manually. If the connector doesn’t fully support your use case, you’re expected to extend it — which means writing code.
So yes, there’s a UI. But you’re still in developer territory.
What it covers
Airbyte is built around an open-source ELT approach.
It handles:
- Data extraction from APIs, databases, and SaaS tools.
- Loading into warehouses like Snowflake, BigQuery, Redshift.
- Incremental syncs and basic transformations.
- Custom connector development via its connector framework.
The real strength is its connector ecosystem — especially long-tail and niche sources that commercial tools don’t always prioritize.
Pricing
Airbyte has two modes:
- Self-hosted (open-source) — free to use.
- Airbyte Cloud — usage-based pricing.
Real Pro
Flexibility.
If you have engineers and need to connect to unusual data sources, build custom connectors, or deeply customize how data is extracted and loaded, Airbyte gives you that freedom.
You’re not waiting on a vendor roadmap.
Real Con
You own the pipeline.
That means handling connector issues, API quirks, scaling, logging, retries — all of it. What starts as a quick setup can turn into ongoing maintenance as data volume and complexity grow.
2. Big Data Storage & Warehouses
Snowflake — Best for Decoupled Compute & Storage
G2: 4.6/5 · Capterra: no reviews4,7/5
There’s a reason Snowflake became the default answer to “where should we warehouse our data” for so many teams. It’s not the cheapest option on the market, and it won’t pretend to be. But what it delivers: separation of compute and storage, virtually zero infrastructure management, and query performance that holds up at serious scale — is genuinely hard to match.
When we connected Skyvia to Snowflake during our integration testing, the target setup was straightforward:
- Create a warehouse.
- Point at a dataset.
- Authenticate.
No cluster sizing decisions, no index tuning, no waiting for provisioning to finish. The data landed cleanly, the schema was right, and queries ran fast from the first run.
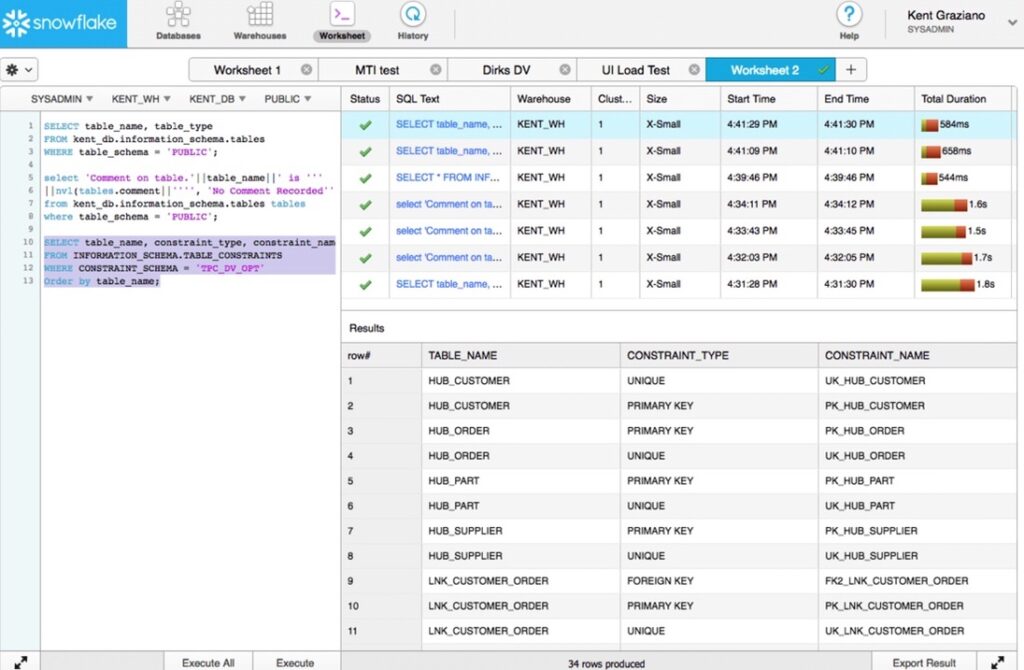
Get in, run SQL, get answers — is what users consistently point to as Snowflake’s strongest quality: it handles large datasets efficiently without burdening the team with infrastructure management.
What it covers
Cloud-native data warehousing across AWS, Azure, and GCP. Separate compute clusters (virtual warehouses) that scale independently, meaning your BI team’s dashboard queries don’t compete with the data engineering team’s nightly loads. The ability to query a table as it existed at any point in time — is one of those features that sounds like a nice-to-have until the first time someone accidentally drops a table and you restore it in two minutes. Add in data sharing, Snowpark for Python and Java workloads, and native integrations with dbt, Fivetran, Airbyte, and Skyvia, and the ecosystem coverage is hard to fault.
Pricing
Compute is billed per second with a 60-second minimum, and you only pay for what you actually use. Storage runs at standard cloud rates. The model is fair in principle. You’re not paying for idle resources, but costs can climb faster than expected if usage isn’t monitored, and the separation of compute and storage makes billing harder to read for teams new to the platform. Most enterprise deployments land in the six-figure annual range once data engineering, analytics, and ML teams are all running their own virtual warehouses.
A free trial is available. Paid plans start from approximately $23/month for light usage, scaling significantly with compute demand.
Real Pro
Decoupled compute and storage is a genuine architectural advantage — teams can scale resources up or down based on demand without touching anything else. Zero maintenance, automatic scaling, and an ecosystem that plugs into virtually every integration and BI tool on the market.
Real Con
Cost management takes active attention. Complex queries and unmonitored workloads can generate unexpected charges, and the billing structure isn’t always intuitive for teams coming from fixed-cost infrastructure. If your data volumes are modest and your queries are simple, the price-to-value ratio starts to feel less compelling. There are cheaper options that’ll do the job.
Google BigQuery — Best for Serverless Scaling
BigQuery is what happens when you take the idea of “managed infrastructure” and push it all the way.
- No servers.
- No clusters.
- No capacity planning.
You just load data and start querying.
When we hooked BigQuery into our test pipeline, the setup was about as minimal as it gets. Create a dataset, authenticate, point the integration — done. No warehouse sizing, no compute tuning, no decisions to make upfront.
It’s almost too easy.
And that’s kind of the point.
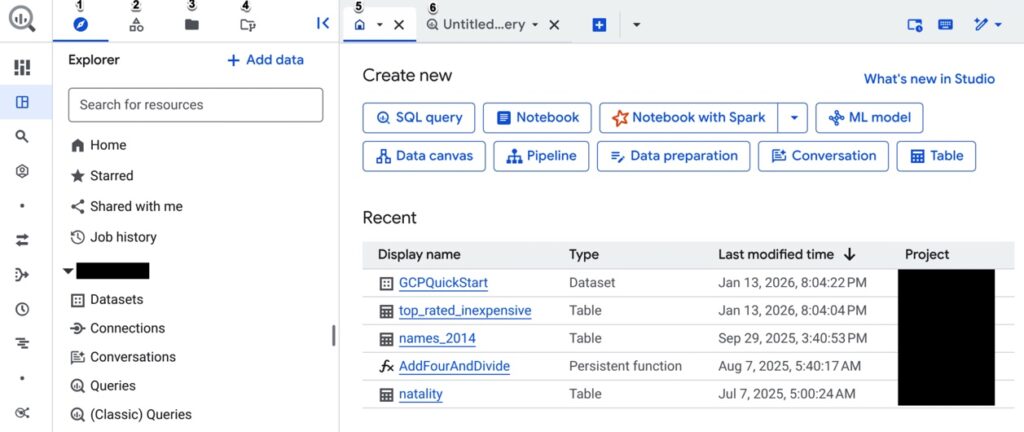
The UI is built around one thing: run SQL, get results. And it holds up even when datasets get large. That’s where BigQuery earns its reputation — not in setup, but in how effortlessly it scales when data volume spikes.
What it covers
BigQuery is a fully serverless data warehouse built on Google Cloud.
You don’t manage infrastructure — Google does. You just focus on:
- Querying large datasets using standard SQL
- Loading structured and semi-structured data
- Running analytics and machine learning directly in the warehouse
- Integrating with tools like Looker, Data Studio, dbt, and ETL platforms
It’s particularly strong for event data, analytics workloads, and anything that benefits from fast, ad-hoc querying at scale.
Pricing
BigQuery pricing is usage-based, but with a twist:
- You pay for data scanned per query (on-demand model)
- Or reserve compute capacity (flat-rate model)
On-demand pricing typically starts around $5 per TB scanned
Which sounds cheap — until queries start scanning more data than expected.
That’s the catch.
A poorly optimized query can scan gigabytes or terabytes in seconds, and you’re billed for all of it.
There’s a free tier (10 GB storage + 1 TB queries/month), but real workloads move past that quickly.
Real Pro
Zero infrastructure, true serverless scaling.
You don’t think about capacity — you just run queries. BigQuery scales automatically, handles massive datasets, and lets teams get answers fast without managing anything behind the scenes.
For analytics-heavy teams, that simplicity is a huge advantage.
Real Con
Unpredictability of the query cost.
Because pricing is tied to data scanned, costs depend heavily on how queries are written. Without partitioning, clustering, or cost controls, it’s easy to burn through budget faster than expected.
MongoDB — Best for Flexible Schema & Unstructured Data
If your data doesn’t fit neatly into rows and columns (nested objects, evolving schemas, event-driven payloads) forcing it into a relational model becomes more work than it’s worth. That’s where MongoDB starts to make sense.
When we tested it, the initial setup through MongoDB Atlas was straightforward. Create a cluster, connect via URI, drop in your dataset — you’re up and running quickly.
- No schema definition upfront.
- No migration scripts just to get started.
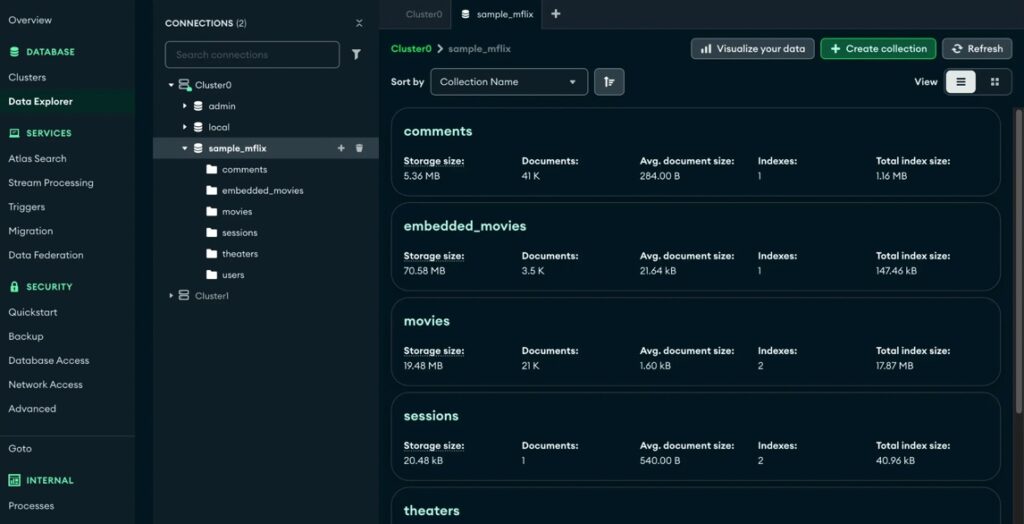
That flexibility is the whole pitch.
What it covers
MongoDB is a document-oriented NoSQL database designed for flexibility and scale.
Instead of tables, you work with collections of JSON-like documents. That makes it a natural fit for:
- Applications with changing or unpredictable data structures
- Event-driven systems and APIs
- High-ingest workloads
- Microservices architectures
It handles horizontal scaling well (via sharding) and integrates cleanly with modern development stacks.
But it’s not trying to be a warehouse — it’s built for operational workloads first.
Pricing
It offers multiple deployment options:
- Free tier (Atlas) for small workloads
- Pay-as-you-go cloud pricing based on cluster size and usage
- Enterprise plans for dedicated deployments
Entry-level plans can start relatively low (around $50/month range), but costs scale with storage, compute, and cluster configuration.
Like most flexible systems, it’s easy to start cheap — and just as easy to scale into something more expensive if usage grows.
Real Pro
Schema flexibility.
You don’t need to redesign your database every time your data changes. That speeds up development, especially in fast-moving environments where requirements evolve constantly.
It’s one of the reasons MongoDB is so popular with product and engineering teams.
Real Con
Not built for relational logic.
If your use case relies heavily on joins, strict relationships, or complex analytical queries, things get awkward fast. You end up pushing logic into the application layer or restructuring data manually.
Cassandra — Best for High-Write, Distributed Workloads
Cassandra shows up in architectures where failure is not an option.
Not “we’d prefer uptime.”
More like “this system cannot go down.”
It’s not trying to compete with Snowflake or BigQuery as a warehouse. It’s built for something else entirely — handling massive write volumes across distributed systems without a single point of failure.
When we tested Cassandra, the setup felt very different from cloud warehouses. You’re not just creating a database — you’re thinking in terms of clusters, nodes, replication strategy.
Spin up a cluster, define keyspaces, configure replication across nodes — and only then start loading data.
It’s more involved. But that’s the point.
Once it’s running, the system is extremely resilient. Data keeps flowing even if parts of the cluster fail, which is exactly what it’s designed for.
What it covers
Cassandra is a distributed NoSQL database built for high availability and horizontal scaling.
It’s designed to:
- Handle massive write-heavy workloads
- Distribute data across multiple nodes and data centers
- Avoid single points of failure
- Maintain uptime even during outages
It’s widely used in systems like real-time analytics, IoT pipelines, and large-scale event tracking, places where data is constantly being written and can’t afford downtime.
But it’s not optimized for analytical queries or complex joins. That’s not its job.
Pricing
Cassandra itself is open-source and free to use.
But in practice, you’re paying for:
- Infrastructure (nodes, storage, networking)
- Operations (monitoring, scaling, backups)
- Engineering time to manage the cluster
Managed services exist, but costs scale with cluster size and performance requirements.
So, while the software is free, running it at scale isn’t.
Real Pro
Fault tolerance.
Cassandra is built to survive failures. Data is replicated across nodes and even regions, so losing part of the system doesn’t stop the rest from operating.
For high-write, always-on systems, that reliability is the whole reason it exists.
Real Con
Operational complexity.
You don’t “just use” Cassandra. You run it. Cluster management, replication strategy, performance tuning, it all sits on your team.
3. Big Data Processing Engines (Transform & Compute)
Databricks — Best for Unified Analytics
Databricks shows up when teams stop separating analytics, data engineering, and machine learning into different tools.
It’s built around the idea that all of that should live in one place.
When we tested it, the setup felt closer to a development environment than a traditional data platform. You spin up a workspace, launch a cluster, open a notebook. And you’re writing queries, running Spark jobs, or training models in the same interface.
That’s the key difference.
You’re not just querying data.
You’re building on top of it.
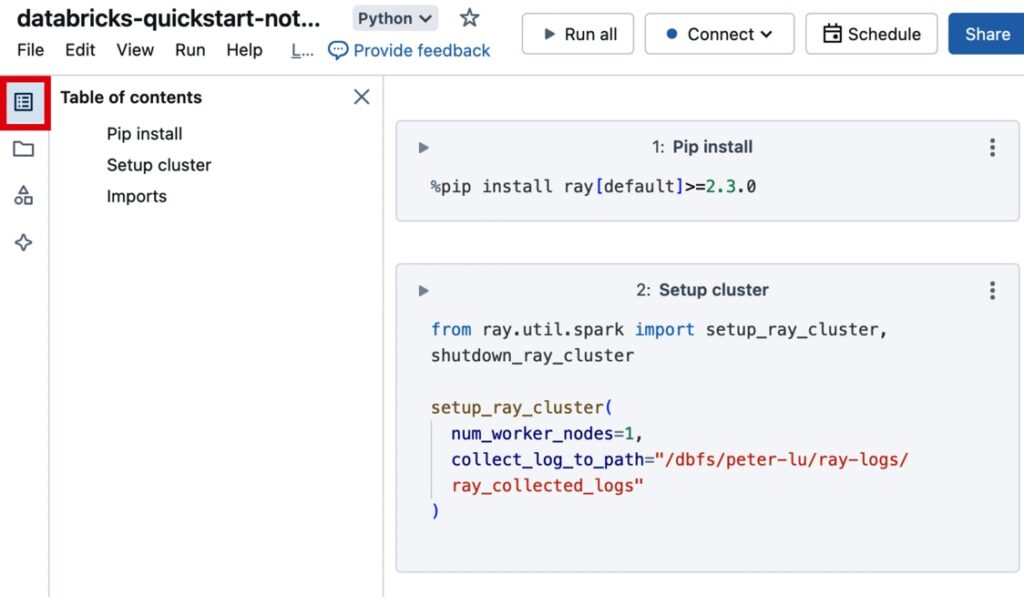
The notebook-driven workflow (SQL, Python, Scala in one place) is what pulls teams in. Data engineers, analysts, and data scientists can all work in the same environment without constantly switching tools.
What it covers
Databricks positions itself as a lakehouse platform — combining data warehouse and data lake capabilities.
In practice, it handles:
- Large-scale data processing (Apache Spark under the hood)
- Data engineering pipelines and transformations
- SQL analytics and BI workloads
- Machine learning and AI workflows
- Streaming and batch processing in one platform
It’s designed for teams that don’t want separate tools for ETL, analytics, and ML — they want one system that does all of it.
Pricing
Databricks uses a usage-based pricing model built around Databricks Units (DBUs), plus underlying cloud infrastructure costs.
- You pay for compute (DBUs)
- You also pay your cloud provider separately (storage, VMs, etc.)
In real-world setups:
- Small teams often land around $1.5K–$3K/month
- Production workloads can reach $15K+ monthly depending on usage
It’s flexible, but not always predictable — especially if clusters are left running or workloads aren’t optimized.
Real Pro
One platform for everything.
Instead of stitching together a warehouse, a processing engine, and an ML stack, Databricks gives you a unified environment. That reduces context switching and makes collaboration across teams much easier.
For data-heavy organizations, that consolidation is a big deal.
Real Con
Complexity and cost visibility.
This isn’t a plug-and-play tool. You’re managing clusters, workloads, and compute usage. And because pricing is tied to multiple layers (DBUs + cloud), it’s not always obvious where the money is going.
Apache Spark — Best for In-Memory Processing
Spark is what teams reach for when “fast enough” stops being fast enough.
It’s built for large-scale data processing, but the real differentiator is in-memory execution. Spark keeps data in memory instead of constantly reading and writing to disk like older systems, which is why it can process workloads significantly faster.
When we ran Spark in testing, the setup felt closer to Databricks than a warehouse:
- Spin up a cluster.
- Open a notebook or job.
- Start running transformations.
But unlike managed platforms, you’re still responsible for how that cluster is configured and scaled.
That’s the trade-off.
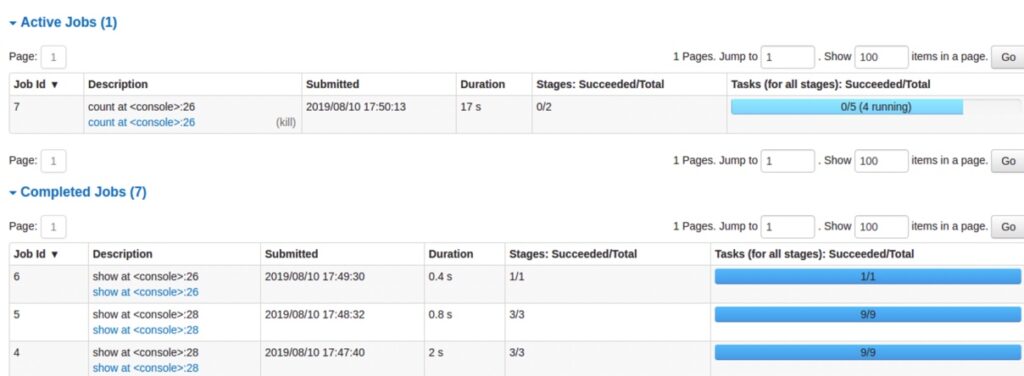
Once it’s running, though, the performance difference is obvious. Large transformations that would take minutes elsewhere finish in seconds when properly tuned.
What it covers
Apache Spark is a distributed data processing engine designed for both batch and streaming workloads.
In practice, it handles:
- Large-scale data transformations
- In-memory processing for high-speed execution
- Batch and real-time data processing
- Machine learning pipelines (MLlib)
- Integration with data lakes and warehouses
It’s not a storage system — it’s the engine that processes data sitting elsewhere.
Pricing
Spark itself is open-source and free.
But like most open-source infrastructure tools, the real cost comes from:
- Compute resources (clusters, memory-heavy workloads)
- Infrastructure management
- Engineering time to build and maintain pipelines
In other words: no license fee, but definitely not “free” in practice.
Real Pro
Speed.
In-memory processing is a real advantage for large transformations and iterative workloads. When performance matters — especially at scale — Spark delivers.
It’s one of the reasons it became a standard in big data processing.
Real Con
Operational overhead.
You don’t just “run Spark”, you manage clusters, tune jobs, and handle scaling. Without experienced engineers, it quickly becomes difficult to maintain.
Apache Hadoop — Best for Legacy On-Premises Systems
G2: N/A Capterra: N/A
Hadoop used to be the default answer to “how do we store and process big data at scale?”
Now, it’s more often the answer to:
“what’s already running in our infrastructure?”
It hasn’t disappeared — far from it. But the role has shifted. Cloud-native warehouses and processing engines have taken over most new deployments, while Hadoop continues to power legacy systems that were built when on-prem was the only real option.
When we tested Hadoop, the setup felt like stepping back into a different generation of data infrastructure. You’re dealing with clusters, HDFS storage, resource managers — all the pieces you now get abstracted away in modern platforms.
It works. But you feel the weight of it.
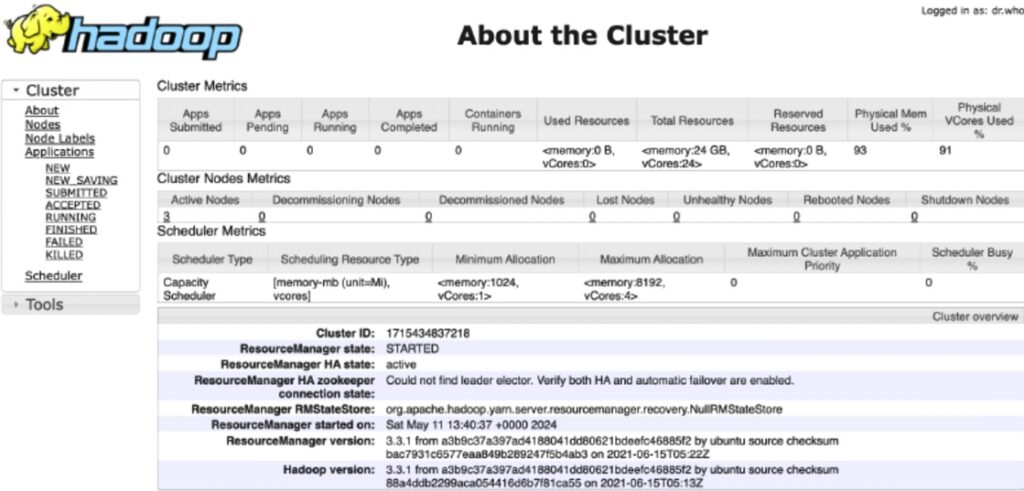
Once configured, it’s stable and proven. But getting there — and keeping it running — takes effort.
What it covers
Apache Hadoop is a distributed data framework built for storing and processing large datasets across clusters of machines.
It includes:
- HDFS (distributed storage layer)
- MapReduce (processing model)
- YARN (resource management)
It’s designed for:
- Large-scale batch processing
- On-prem data storage across clusters
- High fault tolerance in distributed environments
But compared to modern tools, it’s more infrastructure-heavy and less flexible for real-time or interactive workloads.
Pricing
Hadoop is open-source and free to use.
In reality, costs come from:
- Hardware or cloud infrastructure
- Cluster setup and maintenance
- Engineering and operations overhead
Running Hadoop isn’t about license fees — it’s about managing a distributed system at scale.
Real Pro
Proven at scale.
Hadoop has been battle-tested in large enterprises for years. It handles massive datasets reliably and offers full control over storage and processing in on-prem environments.
For organizations already invested in it, it still gets the job done.
Real Con
It’s heavy and aging.
Compared to modern cloud-native tools, Hadoop requires significantly more setup, maintenance, and operational effort. And for most new use cases, there are simpler, more flexible alternatives.
4. Big Data Visualization & BI Tools
Tableau — Best for Complex Visualizations
Tableau is what teams reach for when “a dashboard” isn’t enough anymore.
Not just charts — but layered, interactive visualizations where you can drill down, slice data ten different ways, and actually explore what’s going on underneath.
When we tested it, the setup was straightforward: connect to a data source, pull in tables, start building. The interface is drag-and-drop, but it doesn’t feel limited. You can move fast at first — then go deep once things get more complex.
That balance is where Tableau stands out.
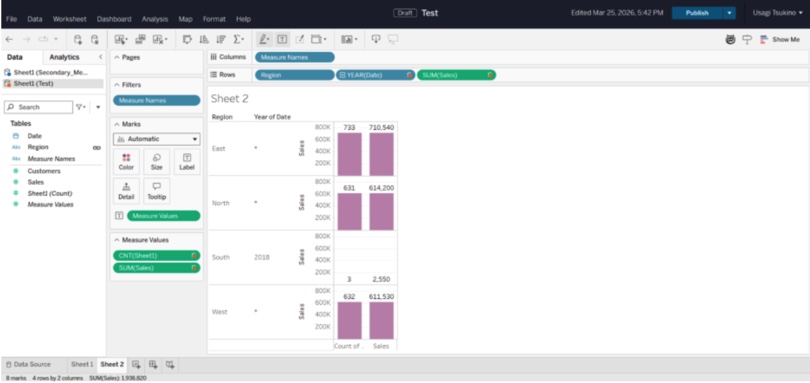
You start with a simple chart. Then you add filters. Then calculated fields. Then parameters. Before long, you’ve built something that would’ve taken pages of SQL and custom frontend work to replicate.
What it covers
Tableau is a full-featured BI and data visualization platform focused on exploratory analysis.
It handles:
- Interactive dashboards and reports
- Drag-and-drop visualizations
- Data blending from multiple sources
- Advanced calculated fields and parameters
- Live connections or extracted datasets
It’s widely used in organizations where data needs to be explored, not just presented.
Pricing
Tableau uses a role-based subscription model:
- Creator (full access)
- Explorer (limited editing)
- Viewer (read-only dashboards)
Pricing typically starts around $75/user/month for Creator licenses, with lower tiers for viewers.
It’s not the cheapest BI tool — especially at scale — but it’s positioned as a premium visualization platform.
Real Pro
Visualization depth.
Tableau can handle complex, layered dashboards that go far beyond basic charts. If your team needs to explore data, not just look at it, it delivers.
It’s one of the few tools where analysts don’t feel boxed in as requirements get more advanced.
Real Con
Learning curve and cost.
It’s easy to start, but hard to master. Advanced dashboards require understanding Tableau’s calculation logic and data modeling approach.
Microsoft Power BI — Best for Microsoft Ecosystems
Power BI is what most teams end up using when they’re already deep in the Microsoft stack.
Excel, Azure, SQL Server connects without friction. It changes how quickly you can go from raw data to something people can use in reality.
When we tested it, the setup felt familiar almost immediately. Import data, drag fields into visuals, publish a report — you’re building dashboards within minutes. If you’ve worked in Excel before, the learning curve is noticeably shorter.
But once you go beyond the basics, you start working with DAX, data models, relationships — and that’s where it shifts from “easy” to “powerful.”
hat mix of accessibility upfront and depth underneath is why it’s so widely adopted.
What it covers
Power BI handles:
- Interactive dashboards and reports
- Data modeling and relationships
- Integration with Excel, Azure, SQL Server, and APIs
- Sharing and collaboration via Power BI Service
- Embedded analytics inside applications
It’s especially strong in organizations already using Microsoft tools, where data flows naturally between systems.
Pricing
Power BI uses a tiered, per-user model:
- Free (individual use)
- Pro: ~ $10–14/user/month
- Premium Per User: ~ $20–24/user/month
- Premium Capacity: ~$5K/month+ for enterprise scale
Real Pro
Ecosystem fit.
If your data already lives in Microsoft tools, Power BI just plugs in. No friction, no extra connectors, no workarounds. That alone makes it the default choice for a lot of teams.
Real Con
Complexity creeps in.
It’s easy to start, but advanced modeling (DAX, relationships, performance tuning) takes time to learn. And with large datasets, performance can degrade if models aren’t designed carefully.
How to Choose the Right Big Data Tools for Your Stack
At this point, the question isn’t “which tool is best?” — it’s “which one actually fits how your team works.”
Most mistakes here don’t come from picking a bad tool. They come from picking the right tool for the wrong context.
Here’s how to think about it.
Technical Expertise
Start with your team, not the tool.
If you have data engineers who are comfortable running clusters, tuning jobs, and maintaining pipelines, open-source tools like Hadoop or Spark give you flexibility and control.
If you don’t, those same tools turn into overhead fast.
In that case, managed platforms like Skyvia remove a lot of that burden. You trade some control for speed and stability. And for most teams, that’s the better deal.
Use Case
What are you actually trying to do?
If you’re running nightly reports or aggregating historical data, batch processing is enough. Tools built around scheduled pipelines and warehouses will handle that just fine.
If you’re dealing with real-time signals — fraud detection, live analytics, event tracking — you need streaming or near real-time processing. That’s a different class of tools entirely.
Trying to force a batch tool into a real-time use case (or the other way around) usually ends in frustration.
Budget & Infrastructure
This is where trade-offs get real.
Cloud-native tools are faster to start and easier to scale. No infrastructure to manage, no hardware decisions, no long setup cycles. You pay as you go.
Self-hosted systems give you more control — and sometimes better alignment with compliance requirements. But they come with operational overhead. Someone has to run them.
There’s no universal answer here.
- If you want speed and simplicity, go cloud.
- If you need control and have the team to support it, on-prem can still make sense.
Conclusion
If you zoom out, the stack breaks down pretty cleanly.
You’ve got tools that move data (integration and pipelines), tools that store it (warehouses and databases), tools that process it (Spark, Databricks), and tools that make it usable (Tableau, Power BI).
Most teams don’t need all of them at once. They grow into the stack, starting with getting data in one place, then making it reliable, then making it useful.
The key is not overengineering too early.
Pick tools that match your current stage, your team’s skill set, and how much complexity you’re actually ready to own. You can always evolve the stack later. Replacing a tool is easier than maintaining the wrong one for years.
And if your priority right now is simple: get data into your warehouse without turning it into an engineering project — Skyvia is a good place to start.
Try the free tier, set up your first pipeline, and see how far you can get before you need to think about anything more complex.

FAQ for How to Load Data from Salesforce to Redshift: 3 Methods

Which is the best data movement tool to move data from HubSpot to ClickHouse?
For fast setup and minimal maintenance, Skyvia works well. It handles incremental sync and schema mapping without custom code. API-based approaches are more flexible but require ongoing maintenance.
Which big data BI tools combine semantic modeling with collaboration features for mid-size enterprises?
Power BI and Looker stand out. Both support semantic layers, shared models, and team collaboration. Tableau can handle this too, but often requires more setup for consistent modeling.
What are the best ML-integrated data analytics solutions for big data workflows?
Databricks leads here with built-in ML workflows. BigQuery ML and Snowflake Snowpark are strong alternatives for teams that want to keep modeling inside the warehouse.
What is typically NOT considered a big data analytics tool?
Tools like Excel or basic SQL clients. They can analyze data, but they’re not designed to process or scale with large, distributed datasets.


