Summary
- Data lineage records a piece of data’s full journey, from the system it started in to every report and model that relies on it today, including each change it went through along the way.
- Table-level lineage tells you which jobs and reports depend on a table; column-level lineage tells you which formula produced a number.
- Snowflake, Databricks and dbt record lineage inside their own walls; the hop from the source app into the warehouse lives in your integration tool's run history.
- Lineage breaks on renames, on values passed between separate queries, and at every system boundary nobody connected.
$1.42 million. Then $1.37 million. Same dashboard. Same period. Zero edits.
Somewhere between the CRM and the CFO’s screen, $50,000 went missing on paper, and someone has to explain where. Teams with data lineage usually do that in ten minutes. Teams without it spend two days on “let me ask around”.
Most explanations of lineage stay abstract, all boxes and arrows with no actual data in them. Here we follow one number instead: from the CRM, where a sales rep typed it, to the CFO’s dashboard, and then back into the CRM as a score. Drop the thread at any hop along the way, and you’re asking around again.
What is data lineage?
Data lineage is the written history of a piece of data. It records where the data started, what changed it along the way and which tables, reports or apps depend on it now. Ask what fed this value (upstream) or what this value feeds (downstream), and you should get an answer on the spot. Strictly speaking, lineage is metadata: it describes how data moves and changes over its lifecycle, but it doesn’t hold the data itself.
Lineage comes in two depths.
- Tables are the shallow one. Table-level lineage maps whole tables and the jobs between them: deals flows into the
revenue_monthlymodel, and that model flows into the finance dashboard. It tells you which room the crime happened in. - Column-level lineage solves the case like a game of Clue: it was
refunded_amount, from the billing system, with a join. Spelled out,net_revenueis amount minusrefunded_amount, and amount arrived from the deal record in the CRM.
Besides these categories, some teams also split lineage into:
- Business lineage, which shows which report depends on which business term.
- Technical lineage, which shows which job wrote which column. Handy terms for a meeting.
But when you’re comparing tools, what matters is whether lineage stops at the table or goes all the way down to the column.
One more definition to settle: lineage is only a part of data governance, not a replacement for it. Deciding who owns net_revenue and what that number is supposed to mean is a governance question; lineage only shows how the number was actually produced. For the ownership side, there’s a separate guide on our blog about data governance in pipelines.
Why data lineage is worth the effort
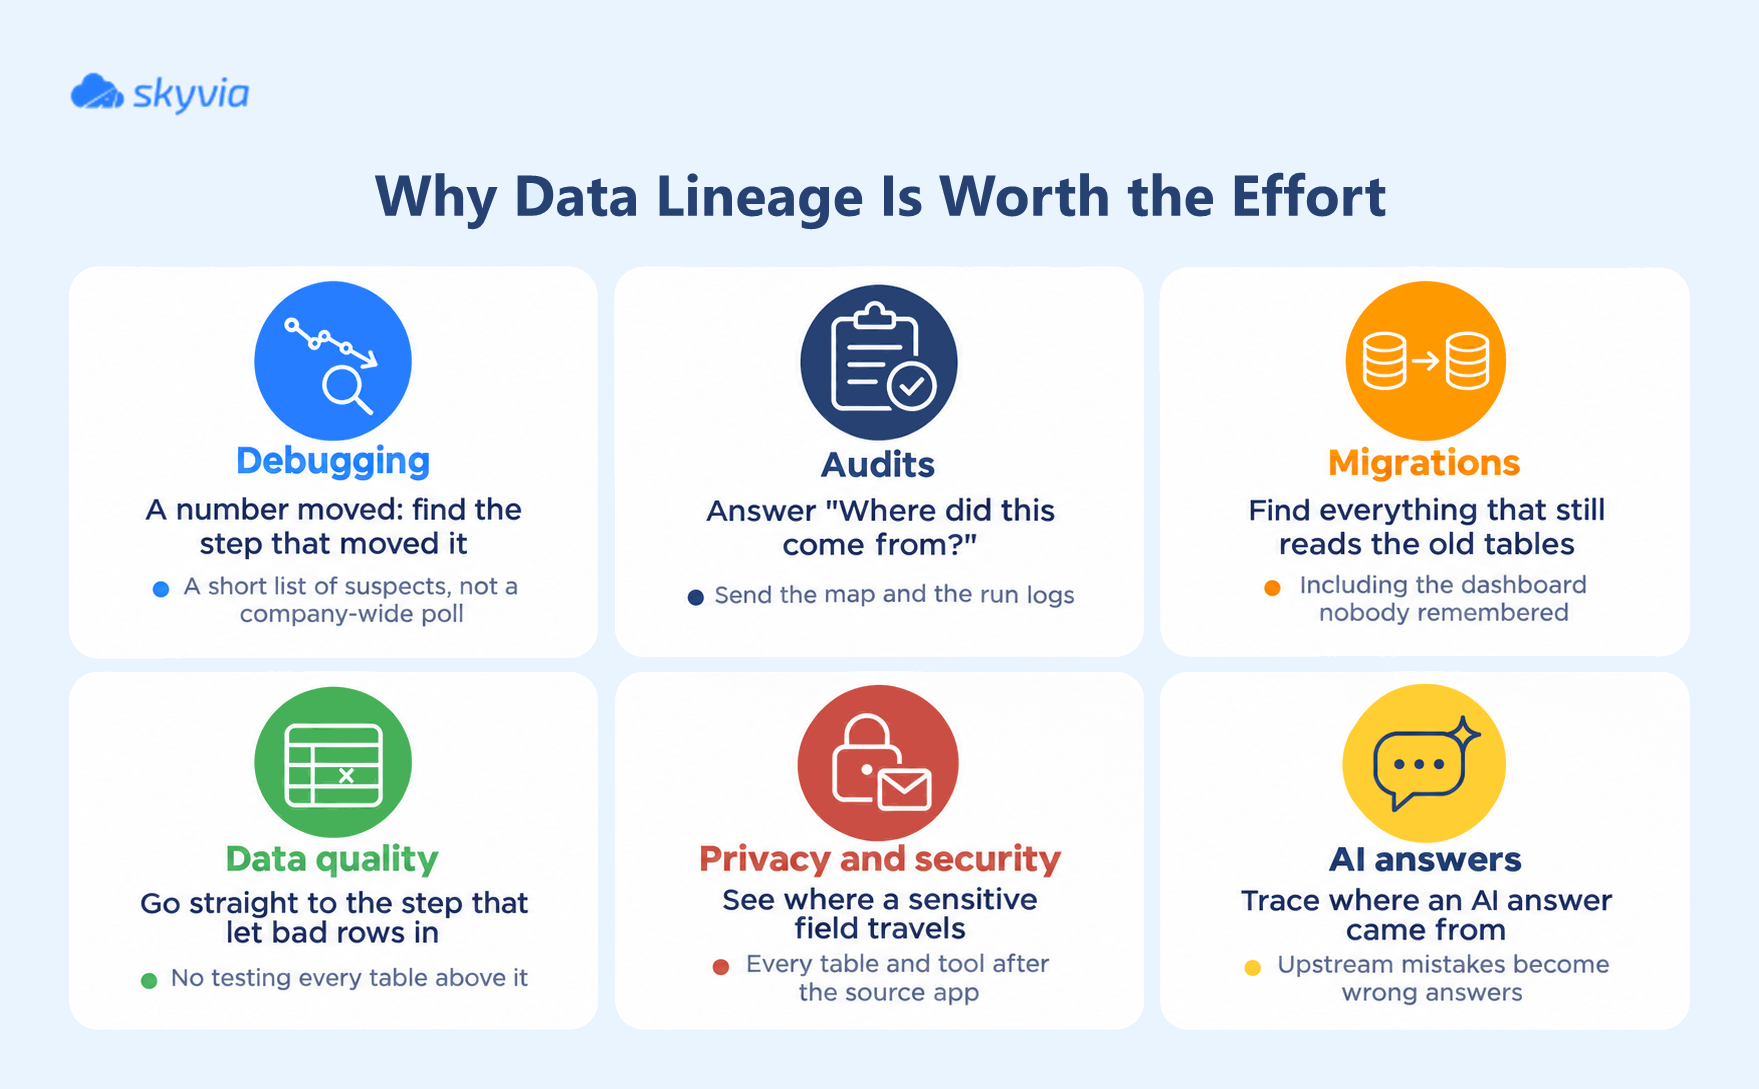
That revenue drop is the everyday case. It’s also the dull one. Instead of polling half the company about who touched what, you get a short list of the steps that could have moved the number. Other reasons come up less often. When they do, they tend to cost real money.
Audits are the classic example of why lineage is worth having. An auditor points at one number (in fact, they usually need more than one number) in your regulatory report and asks, “Where did this come from?” You send the map and the run logs and go home on time. Without lineage, you rebuild its history from memory and Slack messages. Spoiler: there’s no guarantee that you will get to the bottom of the truth.
Migrations come next. Moving to a new warehouse or CRM means finding every query, model and report that still reads the old tables, and lineage gives you exactly that list. It nearly always turns up a dashboard nobody remembered (the one that would have died the day after cutover).
Data quality work moves faster as well. If a check fails on a model, you go straight to the step that let the bad rows in, rather than testing every table above it. Privacy and security reviews lean on lineage in much the same way, to see which tables and tools a sensitive field (an email address, say) passes through after it leaves the source app.
And there’s AI. A model or agent that answers questions from your tables inherits anything that went wrong upstream, so sooner or later someone asks, “where did this answer come from?” That’s a lineage question too, from a new audience.
One number, followed through a pipeline
If every number has a backstory, how much of it survives the trip? We picked one metric column, net_revenue, and followed it through a stack many teams would recognize, from HubSpot all the way back to HubSpot.
- The source app. It begins with a sales rep. They type a deal amount into HubSpot, and that is where lineage has to begin too: with the field, the object it belongs to, and the people allowed to edit it. Suppose two of them can overwrite the amount once the deal is closed. Then the number has two possible pasts before it ever leaves the CRM.
- The integration tool. On a schedule, a replication job copies the deals into a raw Snowflake table (a full load first, after that only new and changed records). This is the hop warehouse lineage usually can’t see. If the loading tool doesn’t send lineage events, the raw table just shows up in Snowflake once rows land, and nothing records which system they came from. What’s left is the integration tool’s run history, which tells you when each run happened, how many rows went through or failed, and why a given record was rejected.
- Staging. Next, a dbt staging model casts amount to a decimal, converts currencies and filters out test deals. Any of those steps can shift the total. A currency rate that changed between two runs is a classic way to get a $50,000 swing.
- The model. Now the math happens. A mart model computes
net_revenue = amount - refunded_amount, then rolls the result up by month. Column-level lineage pulls its weight at this hop, because it reveals thatrefunded_amountarrived from the billing system through a join on the deal ID. Most “why did revenue drop” questions end their search right at that join. - The dashboard. The BI tool reads
revenue_monthly. So far, nothing unusual. Then someone adds a filter inside the dashboard that hides one region, and the warehouse’s lineage graph has no way of knowing that filter exists. - Back to the CRM. The path loops. A reverse ETL job pushes a churn score onto the account record, and part of that score is calculated from
net_revenue. Call it the circle of life, CRM edition: data that left the CRM comes home as a new value, and anyone tracing it has to look upstream and downstream at the same time.
The whole map for this one metric fits in a table. Build the same for the five metrics your company argues about most, and you’ll have covered most of the lineage questions people actually ask:
| Column | Table | Derived from | Transformation | Recorded by |
|---|---|---|---|---|
amount | HubSpot deals | Entered by the deal owner | None | HubSpot field history |
amount | raw.hubspot_deals | HubSpot deals.amount | Copied by the replication job | Integration tool run history |
amount_usd | stg_deals | raw.hubspot_deals.amount | Cast to decimal, converted at the daily rate | dbt model, warehouse lineage |
net_revenue | revenue_monthly | stg_deals.amount_usd, stg_refunds.refunded_amount | Subtracted, grouped by close month | dbt model, warehouse column lineage |
| Revenue tile | Finance dashboard | revenue_monthly.net_revenue | Region filter in the BI tool | BI tool only |
churn_score | HubSpot companies | scores.churn_score (uses net_revenue) | Written back by reverse ETL | Integration tool run history |
Look at the last column. No single system has the full story: the warehouse covers the two modeled rows in the middle, while both ends sit in the apps and the integration tool.
How data lineage gets captured
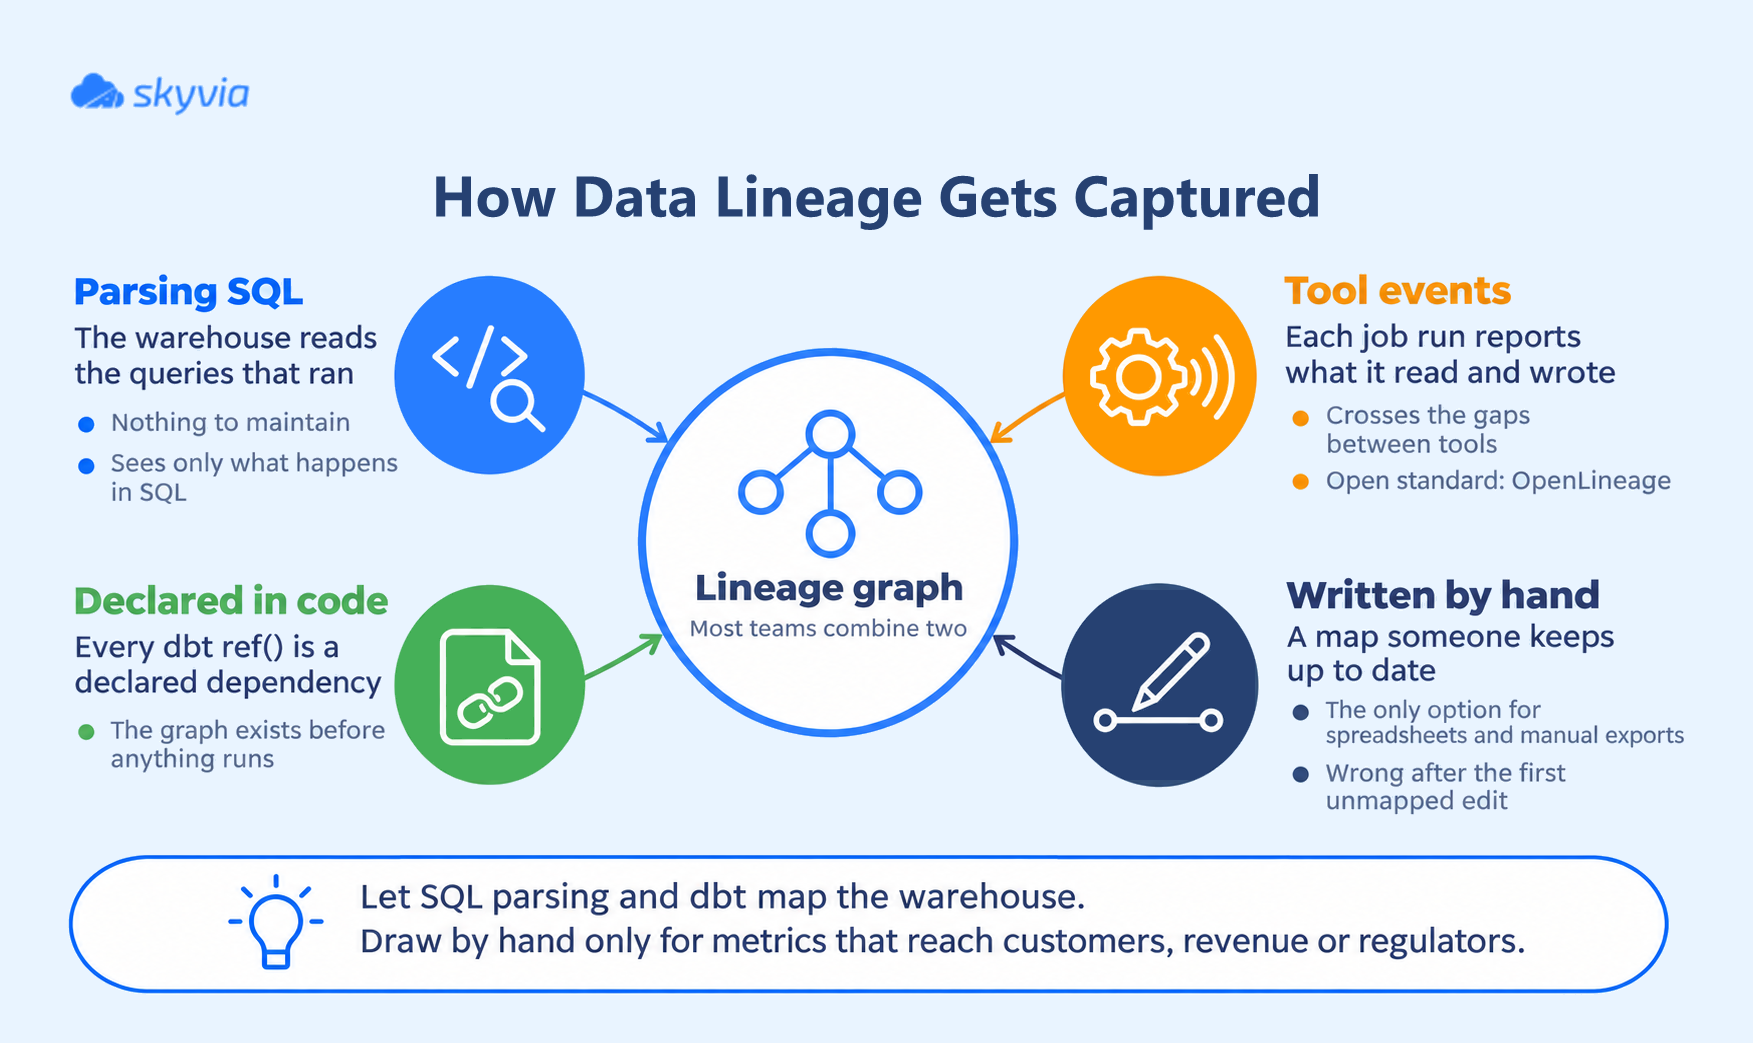
Lineage gets captured in four ways. Most teams combine two.
Parsing the SQL that runs. The warehouse or a catalog reads the queries that create and change tables and works out which columns feed which. That’s how Snowflake and Unity Catalog build their graphs. It’s the most popular method because nobody has to maintain anything, and its limit is just as simple: it sees only what happens in SQL.
Events sent by the tools themselves. Orchestrators and transformation tools can emit a lineage event on every job run, naming the datasets the job read and the ones it wrote. OpenLineage is an open standard for those events; it models jobs, runs and datasets, and it’s how lineage crosses the gaps between tools.
Lineage declared in code. Every ref() between dbt models is a declared dependency, which means the lineage graph exists before anything has run.
Maps written by hand. Basically, a table like the one above. It’s the only option that covers a spreadsheet or a manual export. The hard part is keeping it current, because the first time someone edits a model without touching the map, the map is wrong. If you’d rather keep those links in a catalog than in a spreadsheet, OpenMetadata supports manual editing of both table- and column-level lineage.
Our advice: SQL parsing and dbt can map the warehouse without anyone’s help, so let them. Draw lines by hand only for the handful of metrics that end up in front of customers, in revenue numbers or on a regulator’s desk. Malcolm Chisholm made a similar case in a talk hosted by Snowplow. Lineage needs a job to do, debugging an ETL pipeline, for example. Without one, it piles up as metadata that nobody opens.
Table-level or column-level lineage: which one do you need?
Table-level lineage is enough for “this job failed, what’s affected?” or “can we delete this table?” Chances are you already have it for free, from dbt’s DAG or from the warehouse, and it covers the questions that come up on call every day.
Every schema change is a Jenga move. Most blocks come out clean. Some don’t, and the column three dashboards read is one of them. Pull those without looking, and finance tells you about it after the merge. Column-level lineage lets you look first.
The CEO and co-founder of Orchestra made the same point in one of the company’s newsletters:
“As Data Engineers, it is generally indispensable for assessing the blast radius of pull requests and changes to codebases.” Hugo Lu
One SKU column. That’s all it took. When I was testing ETL tools for an earlier post, a newly added SKU column made the next Skyvia run load zero rows, because the column had been found but left unchecked. No crash, no red banner, just numbers that stopped showing up. Lineage exists to catch exactly this kind of quiet failure before a release.
Renames are sneaky because nothing has to crash for good. A dashboard still pointed at the old name keeps loading. It just stops getting fresh numbers.
So for most teams the answer is table-level lineage everywhere, plus column-level lineage on the few models behind revenue, compliance or anything customers see. Bacancy’s write-up of a lineage build for a representative 400-table Snowflake and dbt warehouse follows the same order: column-level coverage from the start only for the 60 highest-risk objects, table-level for everything else first.
What your stack already records
Before buying a lineage tool, check what the systems you already run are keeping:
| Layer | What it records | Where it stops |
|---|---|---|
| Integration tool | Each run: time, manual or scheduled, rows succeeded and failed, per-record errors | Doesn’t draw a graph; per-record logs are kept for a limited time |
| dbt | The model DAG built from ref() dependencies; column-level lineage in dbt Catalog on Enterprise plans | Column lineage follows SELECT statements, not joins or filters; parsing can fail on complex SQL |
| Snowflake | Table and column lineage from CTAS, INSERT and MERGE, and object dependencies such as views (Enterprise Edition and higher); column lineage kept for one year | Can’t follow data passed between separate, disjointed queries; the source app is outside the graph unless an external tool sends lineage events |
| Databricks Unity Catalog | Lineage captured automatically for queries run on Databricks, down to the column level, across workspaces | Not preserved for renamed catalogs, schemas, tables, views or columns; outside systems appear only if registered |
| OpenLineage | An open standard for lineage events (jobs, runs and datasets) that tools emit and catalogs collect; Snowflake accepts these events from tools like dbt and Apache Airflow (generally available since September 3, 2026) | Only as complete as the tools that emit events |
The gaps are at the two ends: the first hop, from the source app into the warehouse, and the last one, from the warehouse back out to apps. Those are the hops your integration tool’s records cover.
Where Skyvia fits
Skyvia doesn’t draw lineage graphs. What it covers is the stretch of the path your warehouse never sees. Each integration run is logged in Skyvia with a run ID, a state, and counts of succeeded and failed rows, and from a run you can download per-record results showing which source records failed and why.
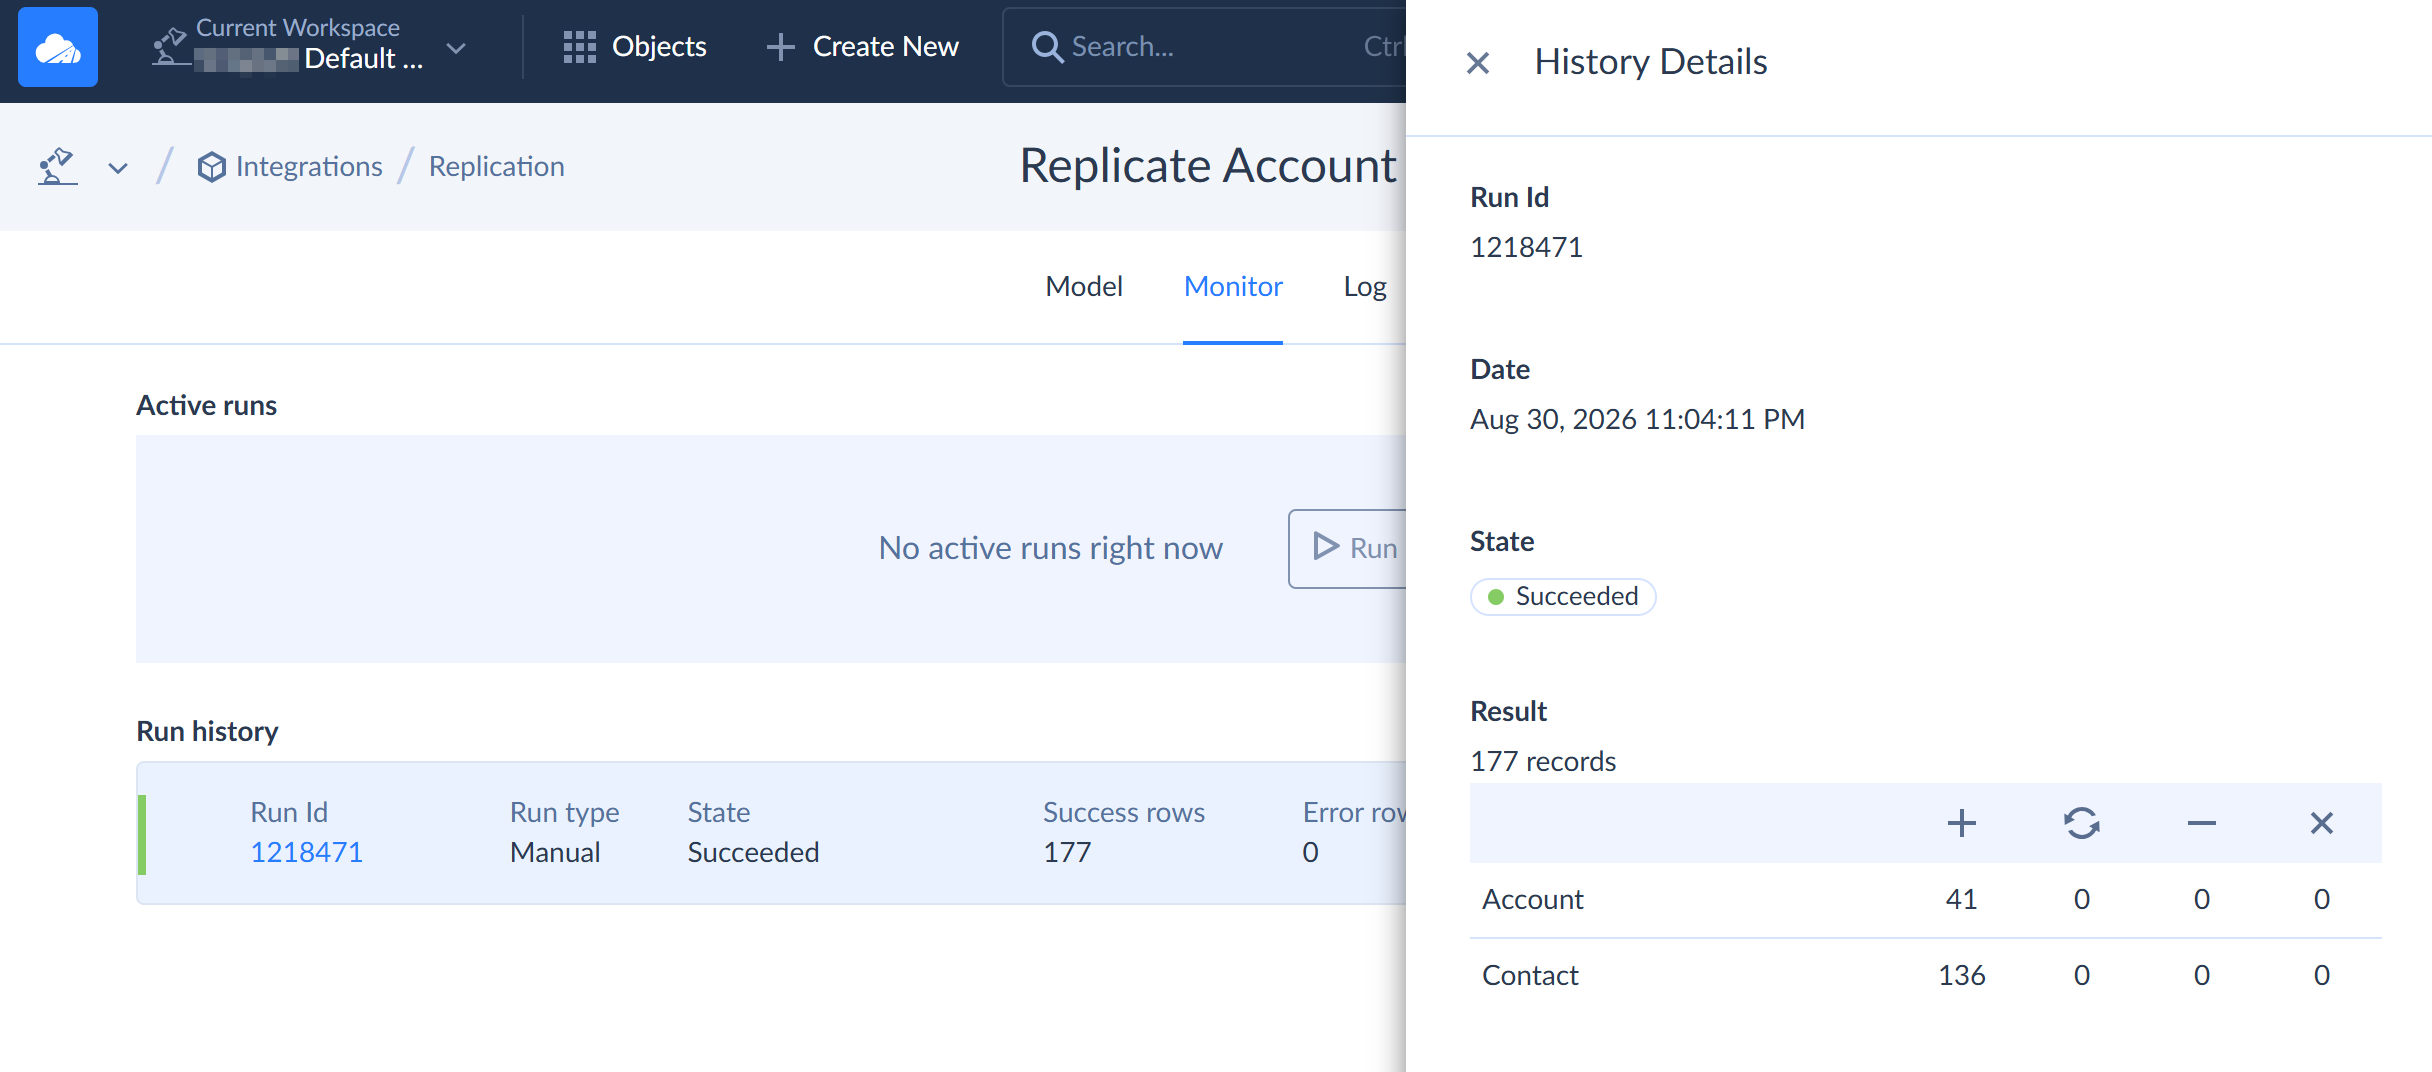
Replication also has a history mode that keeps every version of a record, so you can trace how a value changed in the source. Skyvia can also run your dbt Core project from Git right after a replication, so the model starts only when the load it depends on has finished (Control Flow, on the Professional plan).

Where data lineage breaks
Good lineage still has blind spots, but, thankfully, we know them by sight. Plan around these before you trust a graph:
- Renames. Rename a column in Unity Catalog and its lineage is gone; the column looks like a brand new orphan. Tools that match by name have the same weak spot. In one test on DEV Community, dbt-osmosis mixed up descriptions after two columns swapped names, while SDF didn’t.
- Logic split across queries. If one Snowflake query reads a value into a variable and a second query inserts it somewhere else, that flow won’t show up as lineage.
- SQL that a parser can’t read. dbt’s column lineage comes from parsing SQL. JSON unpacking or a tricky lateral join can leave holes in it.
- Jobs the collector skips. Google’s Knowledge Catalog (formerly Dataplex Universal Catalog) doesn’t collect column-level lineage for BigQuery load jobs, routines, queries whose source tables sit entirely in temporary datasets, or any job that creates more than 1,500 column-level links.
- Logic outside the warehouse. BI filters, spreadsheet formulas, and transformations set up inside the integration tool never appear in the warehouse’s lineage graph.
- The edges. Lineage that starts at the raw table can’t tell you who edited the value back in the source app.
How to check what a column change will break
Figuring out what a change will break is known as impact analysis. This is where lineage earns its keep, since you’re catching problems before anything actually breaks.
- Trace the column’s full reach. Column lineage covers everything inside the warehouse. For the BI tool and integrations, ask their owners. Pull-request checks catch some of it. Paradime’s lineage diff, for instance, flags a column renamed or dropped in a SELECT, but not a change to how that column is calculated.
- Prioritize by risk. Revenue, compliance, and customer-facing numbers come first.
- Communicate the change. Tell every owner what’s changing and when, so field references get updated before the blank tiles appear.
- Validate in a branch. Build everything downstream and compare row counts and totals against production.
- Monitor the rollout. After release, watch the next scheduled runs in the integration tool for new record errors.
Nobody has to do steps 1 and 2 by hand. Catalogs and observability platforms can automate them. Our list of data lineage tools compares what’s available.
Step 5 is the easiest one to forget, and it’s the part Skyvia can take off your plate. Every integration run lands in a log with its state and a count of succeeded and failed rows. Each run keeps per-record results you can download. The failed source records are in there, each with its reason. For changes that hit your dbt models, Skyvia can run your dbt Core project from Git right after the replication, once the load is complete. That’s the smoke alarm for the first and last hops. It won’t map lineage. It will go off when your change breaks something. Try Skyvia free on the pipeline you’re about to change.

FAQ for data lineage

Our data team is small. Do we need a lineage tool?
Probably not yet. If you’ve got a single warehouse and dbt, you already have table-level lineage through the dbt DAG, and your warehouse might give you column lineage as well. It’s worth paying for a tool once things get more complex: multiple warehouses or BI tools, regulators asking for audit trails, or breaking changes that keep surprising your team.
Does column-level lineage have to be switched on?
Not in Databricks. Someone on the Databricks Community forum asked how to get column-level lineage displayed “like table lineage.” A Databricks employee answered in one line: “Good news: there’s nothing to enable.” For tables that Unity Catalog governs, it’s captured automatically. Other platforms tie it to what you pay for. Snowflake records column lineage from Enterprise Edition up. dbt shows it in dbt Catalog, on Enterprise plans.
How long do warehouses keep lineage?
It depends on the platform. Shorter than you’d think, in one case. Snowflake: a year of column lineage. Knowledge Catalog in Google Cloud: 30 days, and that covers all lineage, not just columns. Anything older that an auditor might want has to live somewhere else, either in an export or in a catalog that keeps its own history.
Is data lineage the same as a data catalog?
Not quite. A catalog is an inventory of data assets with owners, definitions and tags; lineage maps how those assets feed each other. Most catalogs show lineage now, but you don’t need a catalog to have lineage, since the dbt DAG alone gives you some.