Summary
- For free website traffic analytics, pick Google Analytics 4.
- To see how people use your product after sign-up, pick Mixpanel.
- To tie B2B marketing to pipeline and revenue, pick HockeyStack or Ruler Analytics.
- To pull every ad platform into one report, pick Supermetrics with Data Studio.
- For SEO and AI-search visibility, pick Semrush.
Ask a marketing team which analytics tool it uses and you’ll rarely hear a single name. Google Analytics has the traffic. Each ad platform reports its own conversions. The CRM knows which deals closed. Then somebody burns Monday morning in a spreadsheet, trying to get the three to agree.
Why the mess? “Marketing analytics tools” is a label stuck on several different jobs. Web analytics counts visits. Product analytics picks people up after sign-up. Attribution platforms connect campaigns to revenue. Reporting tools put every channel on one screen. SEO tools watch where you rank.
We sorted ten tools by the question each one answers. Every entry gives what the tool measures, the entry price and what it’s billed on, how it’s deployed, and its strengths next to the limits we found on the vendor’s own pages. Know your question already? Jump to its tools. Still unsure? The table near the end lines all ten up side by side.
How we chose and checked these tools
One criterion comes first: what it measures. Why do most teams run two or three marketing analytics tools at once? Because each one answers its own question:
- Website traffic: who arrives and from where, plus what gets clicked once they’re on the site.
- Product behavior: what signed-up users do inside the product.
- Attribution to revenue: which campaigns and touchpoints actually sit behind the pipeline and the deals you close.
- Cross-channel reporting: each ad platform’s spend, clicks and conversions, pulled into one report instead of one per platform.
- SEO: your rankings and the keywords behind them, and whether AI answers bring you up at all.
For each tool below you’ll find the question it’s good at and the point where it runs out of road. Then every one gets the same four checks: what you pay for, the entry price and what it’s billed on, the free plan or trial, and how it’s deployed.
Prices, plans and limits all come from the vendors’ own pricing pages and documentation, viewed from the US, and they are accurate as of November 5, 2026. We didn’t run trials for this version, so you won’t find claims about setup time or accuracy here.
A disclosure: we make Skyvia, a data integration platform. It gets its own section ahead of the list because it doesn’t analyze marketing data. It gets that data into one place. We judged every tool here, Skyvia included, on the same criteria and the same fields, limits and all.
A few tools missed the cut, and here’s why. Amplitude, Heap and Kissmetrics do the same job as Mixpanel, so we kept one product analytics tool. Funnel and Salesforce Marketing Cloud Intelligence overlap with Improvado and Supermetrics. Tableau, Domo and Looker are business intelligence platforms, and our data analysis tools list covers them. We also picked a single SEO suite (Semrush) over three, and skipped sales engagement and marketing automation tools that only report on their own campaigns.
Before the dashboards: getting marketing data in one place
Most tools below measure one slice of the funnel. Trouble begins when you want the slices together, say ad spend beside pipeline or web sessions beside closed revenue. When Salesforce asked 4,450 marketers about this for its State of Marketing report, just 26% were completely satisfied with how their data is unified.
Best for loading ad, CRM and web data into a warehouse: Skyvia
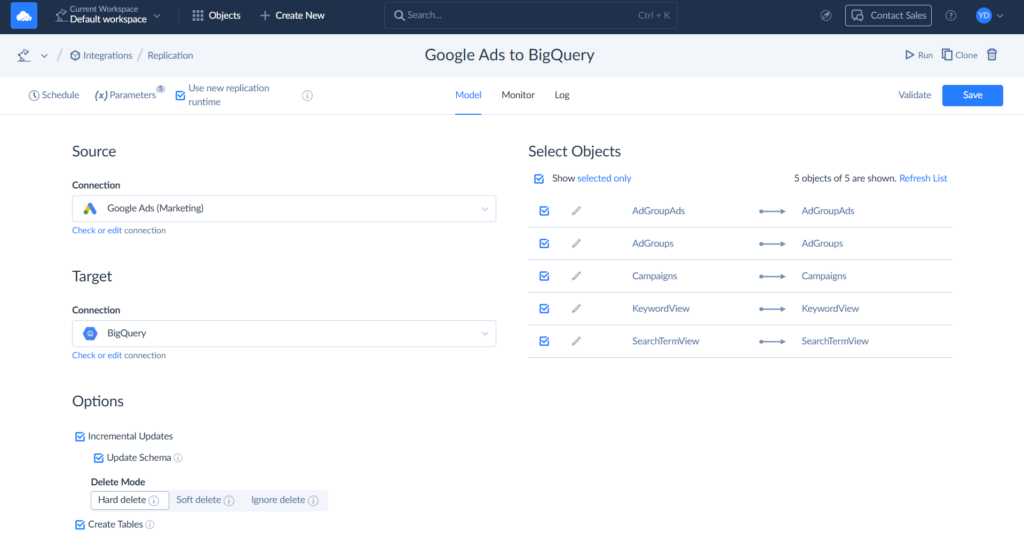
Skyvia is the no-code cloud data platform we build. It doesn’t analyze marketing performance itself. Instead, it replicates data from ad platforms, analytics tools and CRMs into a warehouse such as BigQuery or Snowflake. Teams can also connect supported data sources directly to BI tools without copying the data, as described in our marketing analytics solution.
- Best for: marketing ops and analysts who want ad, CRM and web data arriving in one warehouse on a schedule, with nobody writing a script.
- What it measures: nothing on its own, because it moves the data. The 200+ connectors cover Google Ads, Facebook Ads and LinkedIn Ads, Google Analytics 4, HubSpot, Salesforce and Mailchimp, among others.
- Pricing: you pay by records written a month. At 5M records a month, Basic costs $79 billed annually ($99 billed monthly) with daily runs; Standard at 5M costs $159 billed annually ($199 billed monthly) and runs hourly. There’s also a Free plan, good for 10K records a month.
- Deployment: cloud. A database behind a firewall? An on-premises agent links it over outbound HTTPS.
Strengths
- Unlimited users and connections come with every Data Integration plan, so a new ad account never adds seats to your bill.
- After the first full load, only new and changed records travel.
Limitations
- It won’t model attribution or build dashboards. For that, you’d add a reporting tool on top, such as Data Studio or a BI platform.
- A schema change in a source goes undetected unless you handle it yourself, since Skyvia doesn’t detect those on its own.
- It’s cloud-only. There’s no self-hosted edition.
For a real example, Eagle Intelligence used Skyvia Connectors to bring advertising and CRM data into Power BI. According to the case study, the setup delivered a 25% increase in marketing ROI and 50% faster reporting turnaround within three months.
The 10 best marketing analytics tools
Best for free website traffic reporting: Google Analytics 4
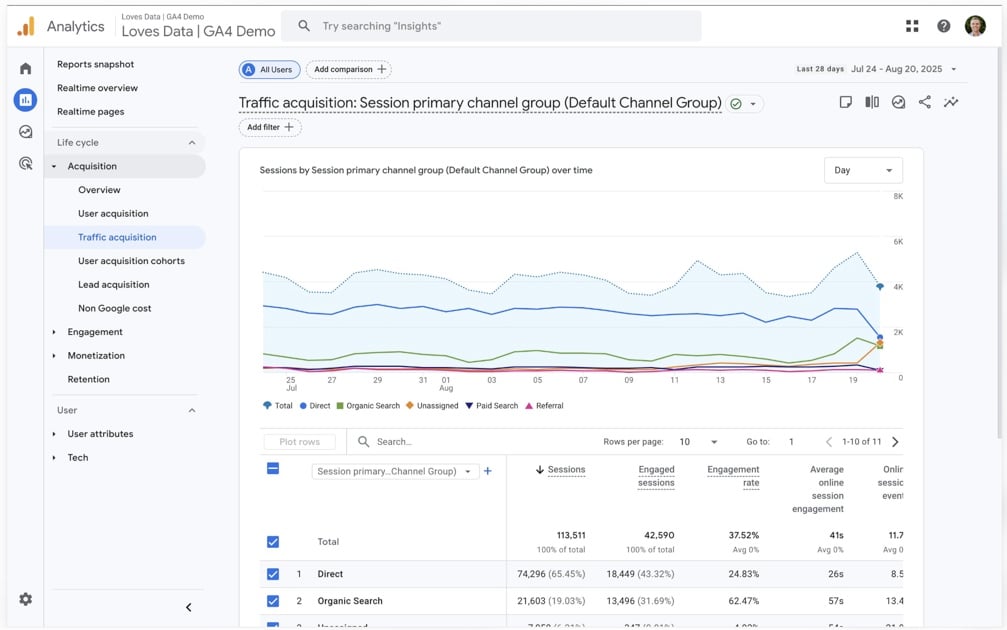
For most teams, Google Analytics 4 is where measurement starts. Put its tag on a site or app, and it records sessions, events and conversions. Reports then break down which channels sent the visitors and the key events. The standard version costs nothing.
- Best for: any team needing traffic, channel and conversion numbers, whether for a website or an app.
- What it measures: website and app traffic and behavior. Key events get credited to channels by a data-driven or last-click model. CRM pipeline and revenue stay invisible to it unless you send them in.
- Pricing: the standard version of GA4 costs nothing. Analytics 360 is quoted by sales and signed with Google or a Google sales partner. You pay a fixed base fee for the first 25M events a month, then a per-event fee in volume tiers.
- Deployment: Google hosts it. Data comes from a tag on the site or app, or from events sent server-side.
Strengths
- Native integrations cover Google Ads, Search Ads 360, Display & Video 360, Search Console and BigQuery.
- Data-driven attribution comes free. Since May 2026 there’s also an “AI Assistant” channel that separates visits from ChatGPT, Gemini, Claude and similar assistants.
Limitations
- On a standard property, event-level data is kept 14 months, no longer.
- Past 10M events per query, explorations get sampled. The daily BigQuery export also caps out at 1M events. Want unsampled explorations? That’s 360.
Best for enterprise-scale web and app analytics: Adobe Analytics
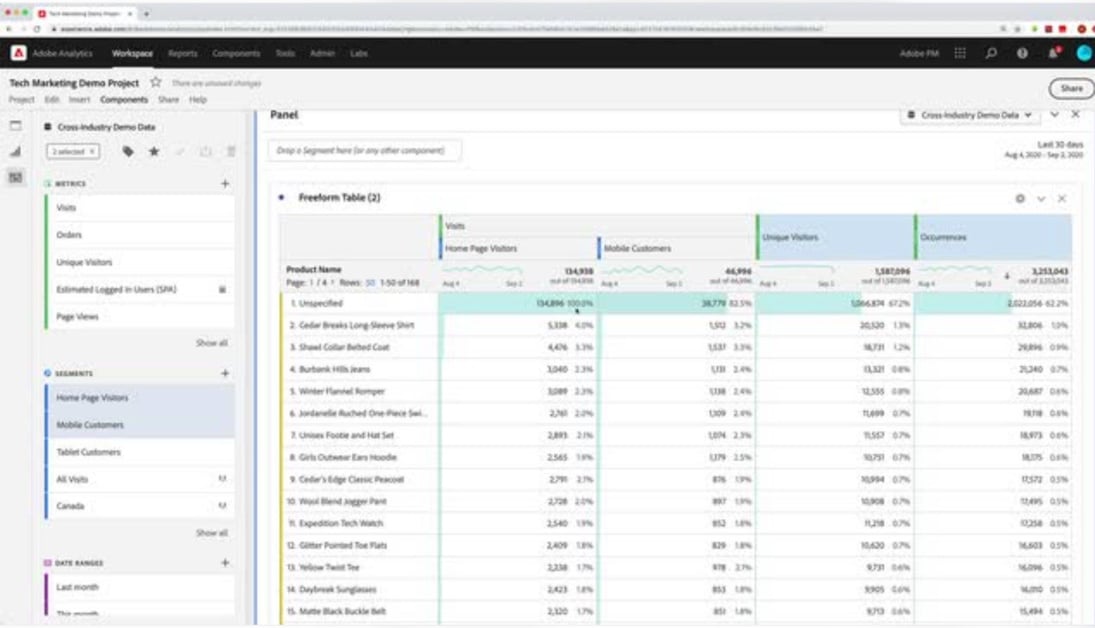
Adobe Analytics is what big companies pick instead of GA4. Segmentation, pathing and custom variables go deep, and everything plugs into the rest of Adobe Experience Cloud. You can only buy it through sales.
- Best for: big companies on Adobe Experience Cloud whose sites and apps are complex, and who have an analytics team to run it.
- What it measures: behavior on the websites and mobile apps you own, from traffic and funnels to segments, paths and attribution. For cross-channel or offline analysis (CRM, call center), Adobe sells a separate product, Customer Journey Analytics.
- Pricing: not published. Select, Prime and Ultimate packages are sales quotes, licensed mainly by server calls (also sites, users and features). Free plan? None. Self-serve trial? Also none.
- Deployment: it runs in Adobe Experience Cloud and collects data either client-side with tags or server-side.
Strengths
- Each report suite gets up to 200 custom eVars and 75 props, and Ultimate raises the eVar limit to 250.
- Every package has anomaly detection, plus activation in Adobe Target, Campaign and Real-Time CDP.
Limitations
- No published price, no free plan, no trial. Even an evaluation begins with a sales call.
- Duplicate “secondary” server calls from multi-suite tagging get billed too.
- Older integrations need rework: Adobe retired the legacy Report Builder add-in in June 2026 and switched off the legacy APIs on August 31, 2026.
Best for what users do inside your product: Mixpanel
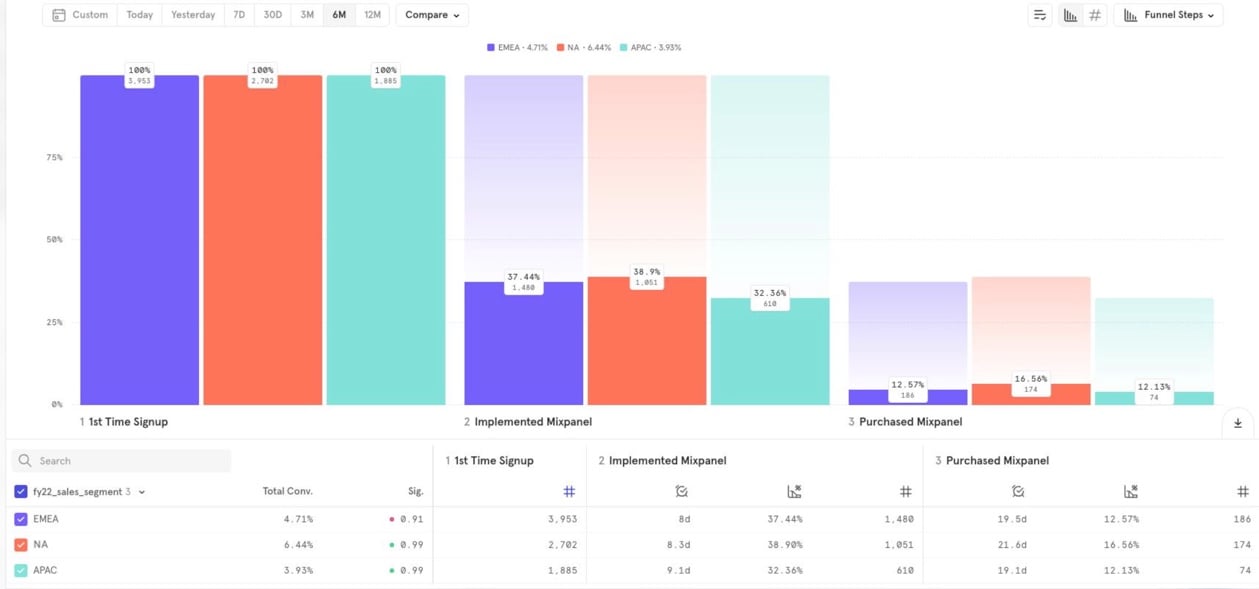
Mixpanel records events inside web and mobile products. Which features get used? Where does a funnel leak? Who comes back next week? Web analytics stops at sign-up. For a software company, that’s exactly where Mixpanel begins.
- Best for: SaaS and app teams who measure activation and retention and want to see which features people use.
- What it measures: product behavior. That means events, funnels, retention and cohorts. Growth and Enterprise add attribution models applied to Mixpanel events (first touch, last touch, linear and others).
- Pricing: priced by event volume. The Free plan covers 1M events a month with no card. Growth starts at $0 for the first 1M events, and at 1.5M events a month Mixpanel’s own calculator shows $140 a month billed monthly or $100 a month billed annually. Enterprise is a quote.
- Deployment: cloud. Data comes in through SDKs, server-side tracking or warehouse connectors.
Strengths
- You get 1M events a month and as many seats as you like before paying anything.
- Every plan, free included, has Session Replay, Heatmaps, Experiments and Feature Flags.
Limitations
- On Free, each seat keeps 5 saved reports, and cohorts can’t be saved.
- Want account-level B2B reports or a warehouse export? Those are Group Analytics and Data Pipelines, both paid add-ons.
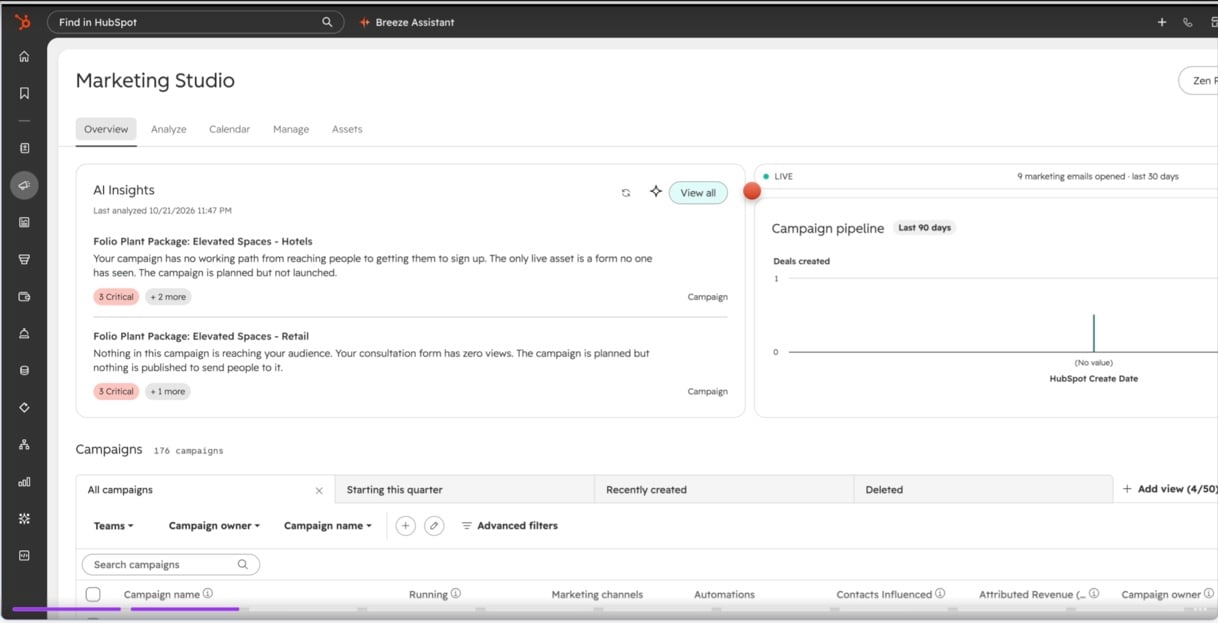
Best for CRM-based attribution: HubSpot Marketing Hub
HubSpot Marketing Hub holds marketing and CRM data in one system. That lets a report trace a single contact from first visit to closed deal. Basic analytics and dashboards cost nothing. Attribution reports begin on Professional.
- Best for: B2B teams with CRM and email already living in HubSpot.
- What it measures: attribution to pipeline and revenue. You also get website traffic and per-channel campaign reports. Contact attribution arrives with Professional, while deal and revenue attribution need Enterprise.
- Pricing: free tools for up to 2 users. Starter lists at $20 a month per seat (new customers are offered $7 a month per seat for a limited time). Professional starts at $800 a month ($890 on the other billing option) with 3 seats and adds a one-time $3,000 onboarding fee. Enterprise starts at $3,600 a month, plus a one-time $7,000 onboarding. Which billing commitment each price assumes? The US pricing page doesn’t say.
- Deployment: cloud.
Strengths
- CRM data sits under every report, which is how a campaign gets credit for the deals it touched.
- If sales works in Salesforce, the two-way Salesforce integration keeps both sides in sync.
Limitations
- Deal and revenue attribution sit in Enterprise only, the most expensive tier.
- Attribution reports sample high-volume interactions above 20 million.
- In 2026 HubSpot swapped its U-, W- and J-shaped models for a single “Empirical” model, so older attribution setups look different now.
Best for B2B pipeline attribution by account: HockeyStack
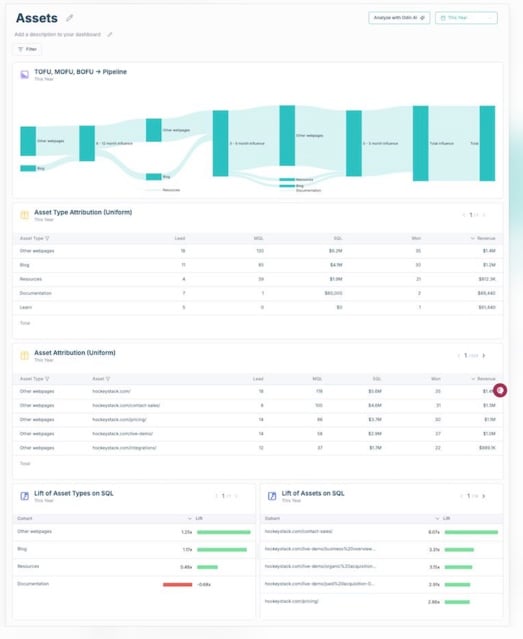
HockeyStack takes anonymous site visits, ad engagement and CRM stages and joins them into one journey per account. Every touchpoint then gets its share of pipeline and closed-won revenue. It’s made for B2B companies whose sales cycles run long.
- Best for: B2B marketing and revenue teams on Salesforce or HubSpot that have to show which programs create pipeline.
- What it measures: attribution to pipeline and revenue, and site behavior from its own tracking script. CRM, ad and automation data arrive through connectors. Models include first touch, last touch, linear, position-based, time decay and a machine-learning “Predictive” model.
- Pricing: not published. You get a sales quote after a demo, and some account intelligence features use credits. There’s no free plan or self-serve trial.
- Deployment: cloud, with data stored on AWS in Frankfurt, and a JavaScript snippet on the site.
Strengths
- Out of the box it tracks without cookies, using a hashed fingerprint, and it doesn’t store IP addresses.
- Conversions go back to the ad platforms and the CRM: offline conversions, Google Enhanced Conversions, Salesforce.
Limitations
- Warehouse import and export require a paid Data Warehouse add-on, which HockeyStack’s engineers set up.
- Expect different numbers from GA4. Its sessions time out after 10 idle minutes, not 30, and a visitor who declines cookies doesn’t show up at all.
Best for call, form and offline revenue attribution: Ruler Analytics
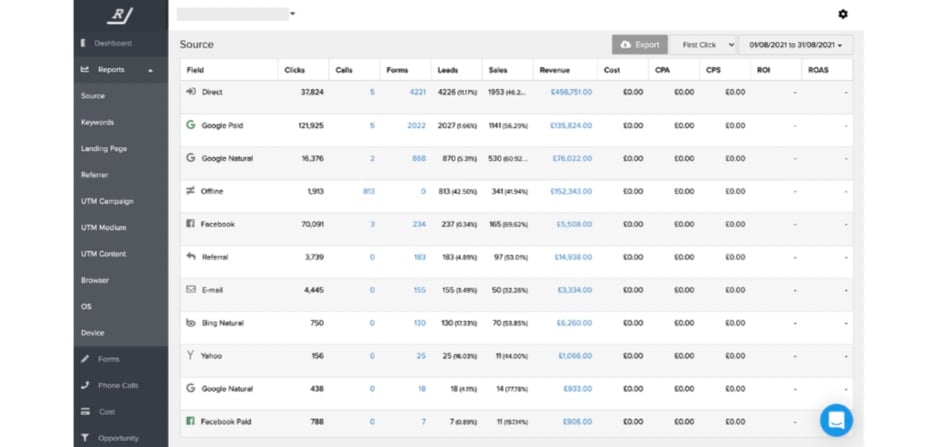
Ruler Analytics tracks each visitor across sessions. Every form fill, phone call, live chat or order gets matched to the marketing that produced it. Revenue comes in from your CRM afterwards. Lead-generation businesses get the most from it, particularly when a lot of deals close offline.
- Best for: lead-gen and eCommerce marketers. Leads aren’t enough for them; they need revenue tied to channels, campaigns and keywords.
- What it measures: which marketing gets credit for leads, pipeline and revenue. Phone calls count too, through the call tracking it ships with. Advanced adds marketing mix modeling.
- Pricing: based on monthly website visits per domain, not seats. For up to 10K visits (Small), it starts at $400 a month billed monthly or $360 a month billed annually; Medium, up to 50K visits, starts at $668 ($601 billed annually). There’s no published free plan or trial.
- Deployment: cloud. You install a first-party tag on the site directly, through Google Tag Manager, or on WordPress.
Strengths
- Call tracking is native, so a phone lead gets credited to the session behind it.
- There’s no cap on users. It also sends revenue back to ad platforms, CRMs, warehouses and BI tools.
Limitations
- Data-driven attribution starts on Medium. Marketing mix modeling only arrives on Advanced, from $2,000 a month billed monthly.
- A refund or cancellation doesn’t drop out of the reports on its own; someone has to delete it. And ad or cookie blockers can stop the tag from firing.
Best for enterprise marketing data warehousing: Improvado
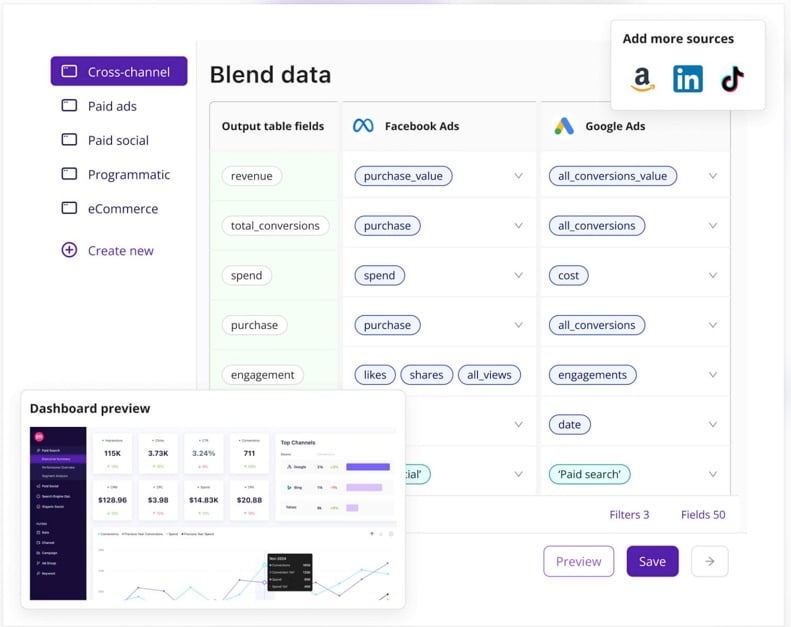
Improvado is ETL, built specifically for marketing data. Data from 1,400+ sources goes into a single model and then into your warehouse or BI tool. An AI agent and data governance rules sit on top. There’s no tracking script; it only works with data other tools collected.
- Best for: marketing teams and agencies juggling many ad accounts, with a warehouse already and budget for an annual contract.
- What it measures: reporting across all your channels. Ad platforms, analytics, CRM and eCommerce tools all feed spend, delivery and conversions into a single normalized schema. Attribution models are a paid add-on, and they work from hit-level data you already collect.
- Pricing: by data volume (rows a year) and AI actions. Starter starts at $20,000 a year (20M rows a year, daily sync), and Growth starts at $41,700 a year. Attribution, mix modeling and incrementality cost extra, from $20,000 a year, and Starter can’t have them. You won’t find a free plan or trial on the site.
- Deployment: cloud. The data goes to your own warehouse (BigQuery, Snowflake, Redshift, Databricks and more) or into Improvado’s storage.
Strengths
- Connectors and destinations come with every plan; nobody charges you per connector.
- Governance rules check naming conventions and campaign settings across platforms (3 rules on Starter, up to 100 on Enterprise).
Limitations
- The entry managed plan is $20,000 a year, which is a lot for a small team.
- Starter syncs daily. Need it twice a day? That’s Growth. Anything quicker is Enterprise.
Best for pulling all your ad platforms into one report: Supermetrics
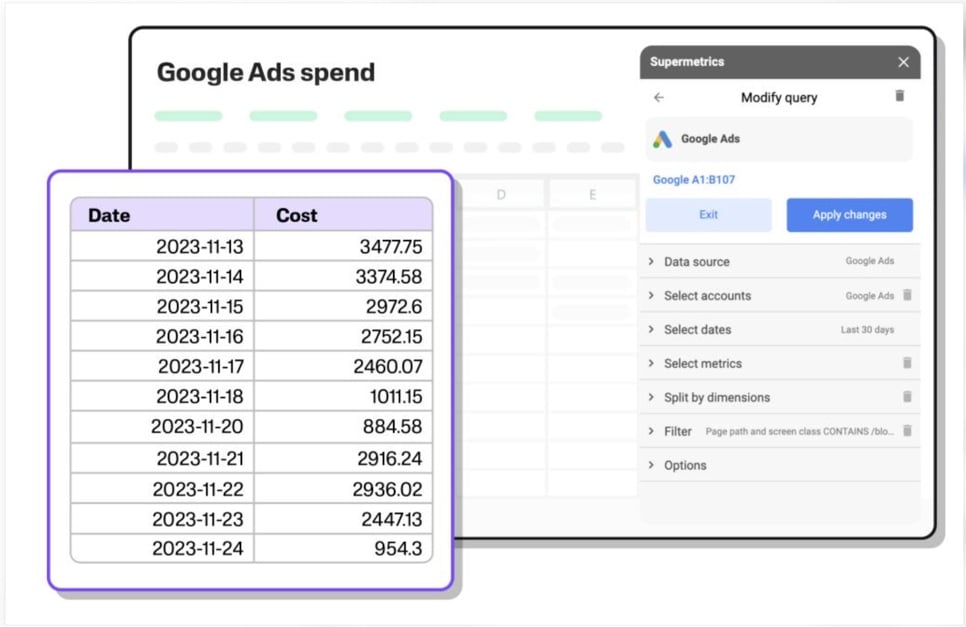
Supermetrics copies what each marketing platform reports (ad spend, clicks, GA4 sessions, social stats, HubSpot deals) into wherever you already build reports. That can be Google Sheets, Excel, Power BI, Data Studio, or its own Supermetrics Studio dashboards.
- Best for: marketers and agencies who build cross-channel reports in a spreadsheet or in Data Studio.
- What it measures: only cross-channel reporting. It repeats what each platform says, and attribution to pipeline is only whatever you build yourself from those sources.
- Pricing: a fixed price per destination rather than by data volume. Starter costs $55 a month billed monthly or $44 a month billed yearly, for one destination and one user, and Growth is $222 ($177 billed yearly). No free plan exists, but there’s a 14-day trial with no card.
- Deployment: cloud, used through add-ons and connectors inside Sheets, Excel, Power BI and Data Studio.
Strengths
- It doesn’t charge by query volume or data transfer size.
- Supermetrics Studio builds a live dashboard from a plain-language prompt or a screenshot.
Limitations
- Data warehouse destinations (BigQuery, Snowflake, Redshift), transformations and the Data API are Enterprise only, and that’s a quote.
- An hourly schedule doesn’t guarantee hourly data. Shopify’s API limits allow roughly two imports a day; Salesforce typically gets one.
- One Google Sheets file can hold 5 scheduled refreshes, no more.
Best for free dashboards over Google data: Data Studio (formerly Looker Studio)
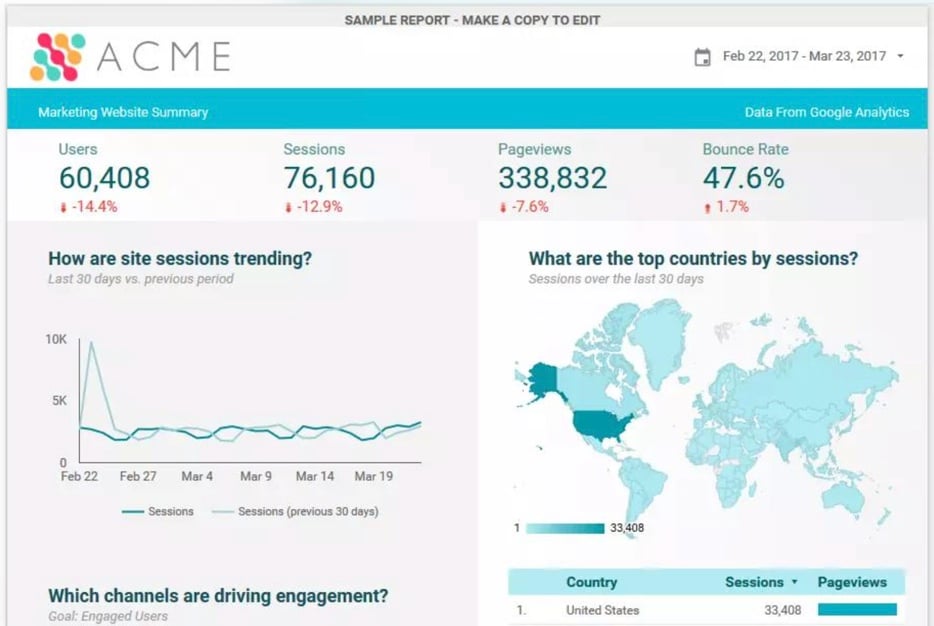
Data Studio is Google’s free reporting tool. Until April 16, 2026, it was called Looker Studio. It stores nothing itself. It pulls charts and dashboards from Google Ads, Google Analytics, Search Console, BigQuery, Sheets and the like.
- Best for: teams that need shareable marketing dashboards and don’t want to pay for a BI tool.
- What it measures: cross-channel reporting, though all it does is draw the charts. It shows what its sources measure. Google sources connect natively, and everything else goes through 1,300+ community connectors.
- Pricing: free for creators and viewers. Data Studio Pro costs $9 per user per project a month, billed monthly whether or not a license is used, and people who only view Pro reports need no license.
- Deployment: a web app, with Pro content living in your organization’s Google Cloud project.
Strengths
- You pay nothing to build or view a report, and any report can be embedded in a web page.
- Since July 30, 2026, Conversational Analytics has been generally available: ask in plain words, and it answers from data agents built in BigQuery.
Limitations
- Meta Ads, LinkedIn Ads and HubSpot need partner connectors built by third parties, at the partner’s price.
- Data from Google Ads and other Google ad products refreshes every 12 hours.
- Team workspaces, organization-owned content and data residency need Pro.
Best for SEO and visibility in AI search: Semrush
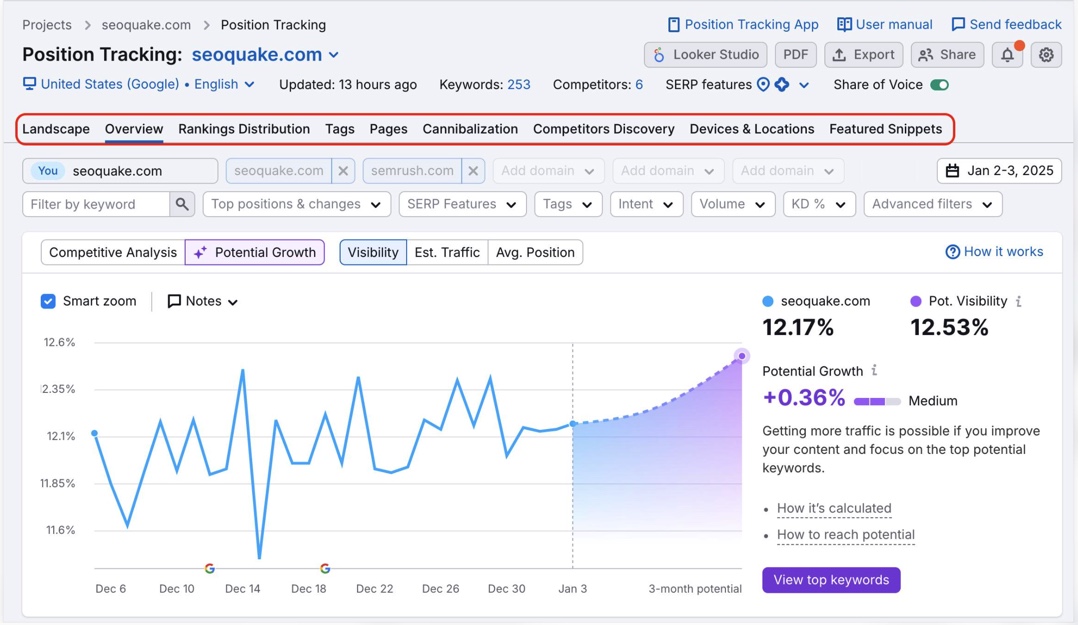
Semrush answers one question: how you and your competitors show up in search. It follows rankings, keywords, backlinks and site health, plus mentions in AI answers. Adobe has owned it since April 28, 2026.
- Best for: SEO and content teams who check rankings and competitors every day.
- What it measures: visibility in SEO and in AI search. It estimates competitors’ traffic but doesn’t track your own visitors or revenue, and GA and Search Console data come in through a reporting add-on.
- Pricing: priced per toolkit. The SEO plan costs $139 a month billed monthly or $117.33 a month billed annually, for 5 websites and 500 keywords tracked daily. Starter, despite its name the next plan up, costs $199 a month. A free plan gives 10 reports a day with no card, and there’s a 7-day trial.
- Deployment: cloud, with API access, and MCP access from Starter.
Strengths
- By Semrush’s own count, the data covers 29 billion keywords and 43 trillion backlinks across 142 geo databases.
- From Starter up, one plan includes SEO and AI visibility, with 50 AI prompts tracked a day.
Limitations
- Reporting is an add-on: Base Report at $10 a month (GA and Search Console, PDF export) or Pro Report at $20 a month.
- Social media is a separate toolkit, from $20 a month billed annually.
- Content optimization and historical SEO data start on Pro+ at $299 a month.
Which tool fits which job
- You need to know where site visitors come from, for free: Google Analytics 4 is the pick.
- Your site is large, complex and already on Adobe Experience Cloud: go with Adobe Analytics.
- You sell software and need to see activation and retention: Mixpanel covers it.
- Your CRM is HubSpot and you want campaign-to-deal reporting in one system: HubSpot Marketing Hub, with deal attribution on Enterprise.
- You’re B2B, on Salesforce or HubSpot, and need account-level pipeline attribution: that’s HockeyStack.
- Many of your sales start with a phone call or close offline: Ruler Analytics was built for it.
- You run dozens of ad accounts and want all of it in a warehouse, with budget to match: Improvado. On a smaller budget, Skyvia loads the same sources into a warehouse.
- You report in Google Sheets or Data Studio and want every ad platform in it: Supermetrics.
- You need free dashboards on top of Google data: Data Studio, no contest.
- SEO and AI-search visibility are your channel: Semrush.
Marketing analytics tools compared: what each measures and costs
| Tool | What it measures | What you pay for | Entry price | Free plan or trial |
|---|---|---|---|---|
| Skyvia | Nothing itself: moves ad, CRM and web data into a warehouse | Records written a month | At 5M records: Basic $79 a month billed annually ($99 monthly) | Free plan, 10K records a month |
| Google Analytics 4 | Website and app traffic, channel attribution | Free; 360 by events | Free; 360 by quote | Free |
| Adobe Analytics | Web and app behavior at enterprise scale | Server calls | Not published: sales quote | None |
| Mixpanel | Product behavior after sign-up | Events | Free up to 1M events a month; 1.5M events $140 a month billed monthly | Free plan |
| HubSpot Marketing Hub | Attribution to pipeline and revenue, in the CRM | Seats and tier | Starter $20 a month per seat | Free tools, 2 users |
| HockeyStack | B2B pipeline and revenue attribution | Not published | Not published: sales quote | None |
| Ruler Analytics | Lead, call and revenue attribution | Website visits per domain | Small $400 a month billed monthly ($360 annually) | None |
| Improvado | Cross-channel reporting in a warehouse | Rows a year and AI actions | Starter from $20,000 a year | None |
| Supermetrics | Cross-channel reporting in Sheets, Data Studio, BI | Destinations | Starter $55 a month billed monthly ($44 yearly) | 14-day trial |
| Data Studio | Dashboards on connected sources | Pro licenses | Free; Pro $9 per user per project a month | Free |
| Semrush | SEO and AI-search visibility | Toolkits | SEO plan $139 a month billed monthly ($117.33 annually) | Free plan, 7-day trial |
How a marketing analytics stack fits together
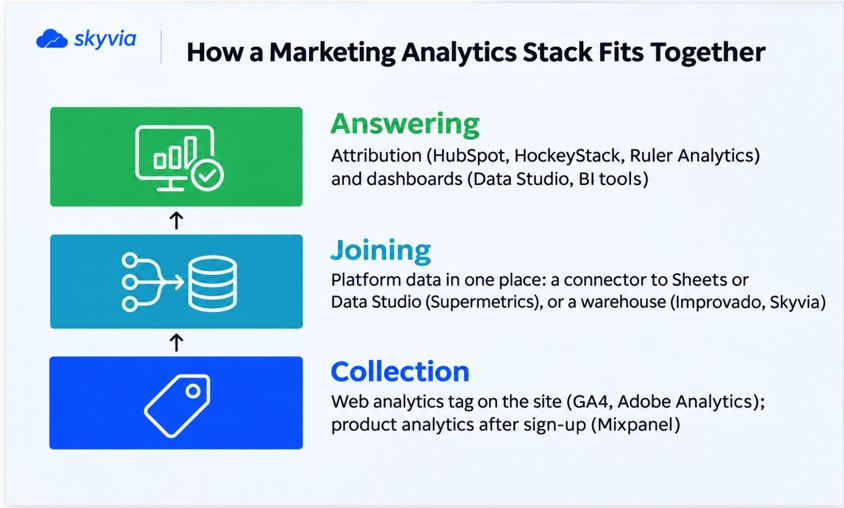
One tool rarely covers it. Most stacks come in three layers:
- Collection: a web analytics tag on the site (GA4 or Adobe Analytics), plus product analytics after sign-up (Mixpanel) if you sell software.
- Joining: the platforms’ data brought together, either through a connector into a spreadsheet or Data Studio (Supermetrics) or into a warehouse (Improvado, or a data integration tool such as Skyvia).
- Answering: attribution and reporting on top. Ask a revenue question and you’ll need HubSpot or a B2B attribution platform like HockeyStack or Ruler Analytics. Dashboards belong in Data Studio or a BI tool.
Trust is where most stacks wobble. In the MMA’s April 2026 State of Marketing Analytics survey, 103 senior marketers answered, and just 30% trusted their KPIs enough to base strategy on them. A TransUnion and EMARKETER survey of 196 US marketers adds that 60% said stakeholders question their metrics. Another dashboard rarely fixes that. What helps is one agreed source of truth for spend, leads and revenue.
Attribution models in plain words
Behind every sale sit several touchpoints, and attribution is how you decide which of them earns the credit. First-touch hands the whole credit to the first interaction, which makes awareness campaigns look great. Last-touch flips that and rewards the final step, usually search or retargeting. Multi-touch shares the credit across the journey by a fixed rule: equal, time decay or position-based. With a data-driven model, an algorithm learns the weights from your real conversion paths. Marketing mix modeling ignores individuals altogether. It works top-down, from spend and sales over time.
In B2B, start by deciding what counts as the conversion: a demo request, an opportunity or a closed deal. After that, make sure the CRM records the campaign that brought each one in. Get the revenue data connected; the choice of model comes second.

FAQ for Marketing Analytics Tools

Web analytics vs marketing attribution: what’s the difference?
Web analytics covers what happens on your own site, meaning visits, sources, pages and conversions. Attribution follows people from one touchpoint to the next and ties them to revenue. For that it usually needs web data joined with the CRM. That’s how a campaign earns credit for a deal that closed months later.
Do you need a data warehouse for marketing analytics?
Not at first. Most teams begin with GA4 and a reporting tool like Data Studio. A warehouse starts paying off when you need ad spend, web data and CRM revenue in one query, longer history than each platform keeps, or a BI tool for the whole company.
Which marketing analytics tools should a small team start with?
Most start with Google Analytics 4 on the site, plus Data Studio and a connector for the ad platforms. Once someone asks which campaigns bring revenue (not just visits), add an attribution view based on the CRM.
Marketing data spread over a dozen ad platforms and a CRM? Then start with Skyvia’s free plan: replicate Google Ads, Facebook Ads, GA4 and HubSpot into one warehouse, and point any tool on this list at the same numbers.