Data blending is the process of combining data from various sources into a single, unified dataset.
Data blending is different from the traditional way of data integration. It does not perform aggressive transformations that load the result into a central repository like a database.
The purpose is to give insights from different data sources without setting up an Extract, Transform, Load (ETL) pipeline. This simplicity offers benefits in business intelligence efforts.
This article will cover how it works, as well as its differences from ETL and its practical use.
Let's begin.
Benefits of Data Blending
Data can be blended from various sources of different formats and structures with the help of business intelligence (BI) tools.
These tools can combine and visualize data, even when the data sources do not have direct relationships with each other.
Compared to data integration, this approach to data analysis offers a range of benefits:
Faster Insights
Blended data using a BI tool is ready for analysis. There's no need for heavy transformations and saving the results in a database or data warehouse. That's why designing and building an ETL process is not a requirement.
The process gives the latest information on every data extraction, allowing the user to use the most updated data. There's no waiting for the next batch run.
With blending data, organizations can make informed decisions faster without the complexity and cost of traditional data integration methods.
Combines Multiple, Unrelated Data Sources
Organizations can use data blending tools to combine data from relational databases, cloud CRMs, flat files, and other formats. These different formats don't have direct relationships like relational database tables, but they still have enough information to be combined.
Some common data relationships involve sales dates and campaign dates, country codes and names, and other information common to different datasets.
No Need for A Centralized Database
Traditional data integrations like ETL need to store the combined data as the last step. Data blending needs only light transformations and bypasses the loading step. Depending on the tool, blending occurs at the visualization level.
This allows organizations to analyze mixed data even without data warehouses. With the right tool, they can visualize their data and make informed decisions out of it.
Simplifies Complex Data Relationships
Tools capable of data blending can automate column mappings and relationships between different datasets by using column names and data types. Linking transactional data with external datasets allows richer analyses, such as market trends or customer behaviors.
User-Friendly for Non-Technical Users
Many data blending tools have user-friendly interfaces. This allows business users or analysts without coding skills to combine datasets and perform analyses. This empowers them and reduces the need for IT intervention.
Cost Efficiency
Data blending reduces the need for expensive infrastructure and complex data integration processes. This is more cost-effective for smaller organizations or for those who only need quicker insights.
How Data Blending Works
Data blending needs components and the right steps to make it work. This section will discuss all these requirements.
Components Needed for Data Blending
-
Primary Data Source: The main dataset to work with.
-
Secondary Data Source(s): Additional datasets to combine with the primary one.
-
Blending tool/software: A data visualization or business intelligence tool that supports data blending, such as Tableau, Power BI, etc.
-
Common Key/Field: A shared field like "Customer ID," "Date", or "Product Code" that exists in both datasets to link them together. This does not require primary and foreign keys as in a relational database.
The 4 Steps in Data Blending
-
Connect to Data Source
Using a BI tool, connect to the primary and secondary data sources. For example, the primary source could be a PostgreSQL database, while the secondary source might be Salesforce.
-
Choose the Primary and Secondary Data Sources
Choose one data source as the primary (the main dataset) and others as secondary sources. The primary source drives the analysis, and the secondary sources add further details.
Regardless of the data source, specify the table(s) or file(s) from the primary and secondary data sources.
-
Identify a Common Key
Find a column or field that exists in both data sources. This will be used to match and merge the primary and secondary datasets during the blending process. For example, both data sources might have a "Coutry Code" or "Transaction Date".
-
Blend the Data
In your BI tool, blend the data using the common key. The tool will create a visual relationship between the datasets based on this common key. It will automatically fetch relevant data from both sources in real-time.
Then, add visualizations to your report or dashboard, like a bar graph or table.
The blending happens at the visualization level. There is no need to move or merge the actual data. Modify the report or dashboard as needed.
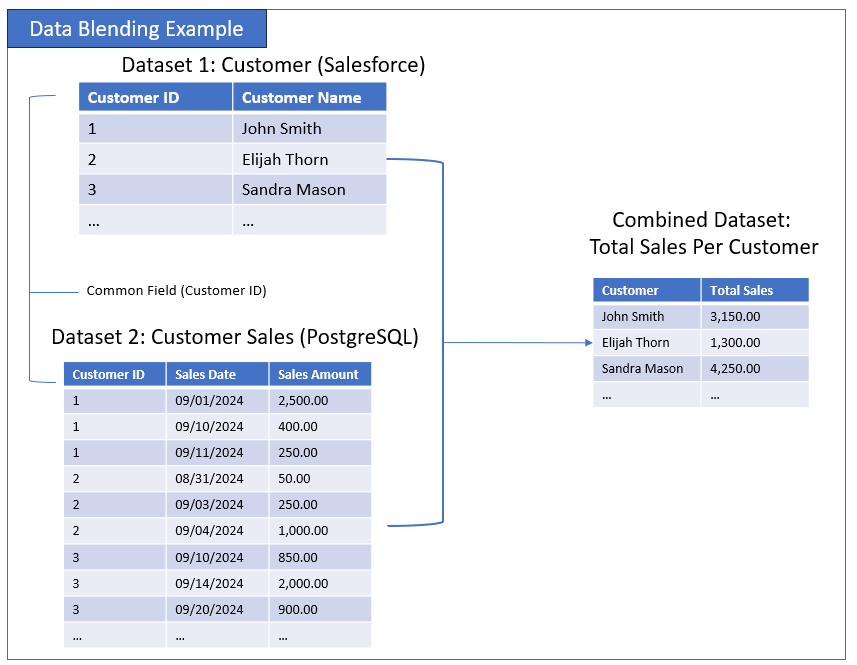
Simple Example
-
Primary Data: Customer info from Salesforce
-
Secondary Data: Customer sales in PostgreSQL.
-
Common Field: Customer ID.
-
BI Tool: Power BI.
-
Steps:
- Create a blank Power BI report and connect it to Salesforce.
- Specify the Salesforce Customer Object and the PostgreSQL Sales table.
- Connect the common field (Customer ID)
- Add a visualization to display Total Sales per Customer.
The following illustrates the above example and the blending outcome:
5 Popular Tools for Data Blending
-
Tableau
Tableau is widely used for data visualization and supports data blending. It lets organizations combine data from multiple sources like databases, cloud services, and spreadsheets by simply dragging and dropping fields with a common key.
-
Power BI
Power BI by Microsoft is another leading BI tool that is user-friendly. It also supports data blending, like Tableau. Power BI can connect to a variety of sources and blend them into a single report by linking fields like "Customer ID" or "Date". It uses wizards and drag-and-drop to quickly design data visualization reports and dashboards.
-
Alteryx
Alteryx is great for data blending and preparation. It has a drag-and-drop interface to blend datasets from different sources, perform analysis, and generate visual reports.
-
QlikView/Qlik Sense
Qlik tools offer associative data models to allow seamless blending across datasets. Qlik Sense is particularly good for self-service data blending, with real-time linking of fields from multiple data sources.
-
Looker Studio
Looker Studio from Google is a modern data platform with built-in support for data blending, especially suited for web-based datasets or cloud services. It connects different sources and blends them at the analysis level.
Common Data Blending Techniques to Choose From
Combining data requires some techniques depending on the reports or dashboard presentation. The following are some of them:
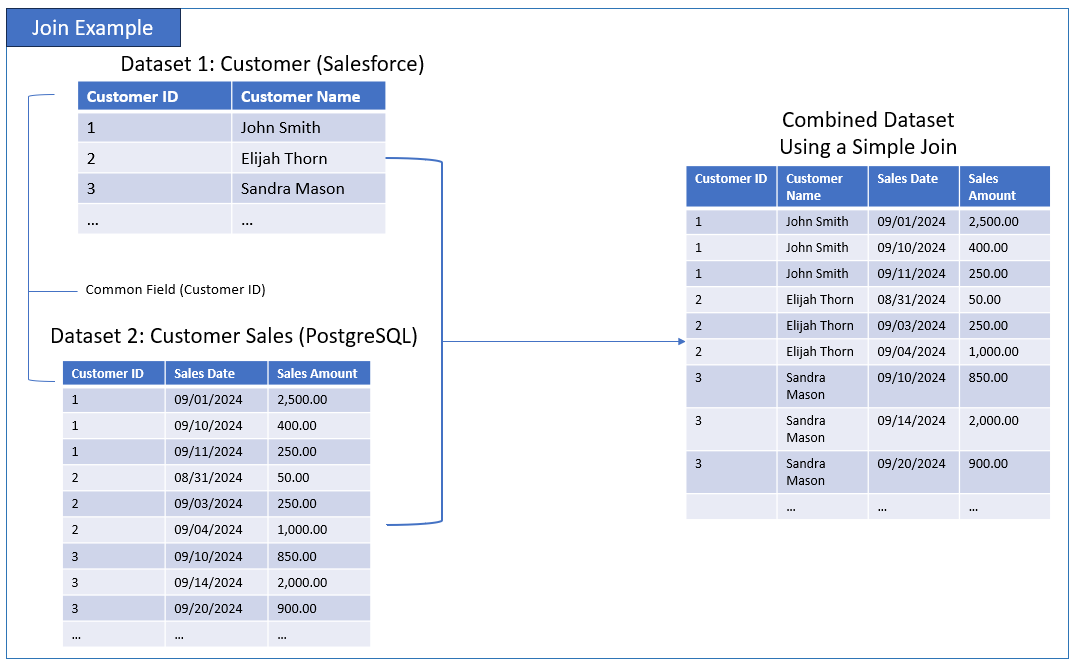
Joining
The first technique to blend two or more datasets is joining. You can use the common field or column to combine the datasets and select columns for use in reports or visualizations.
Both customer and customer sales datasets have a common field called Customer ID. To illustrate a simple join, the following combines the two information of customer and customer sales:
Aggregation
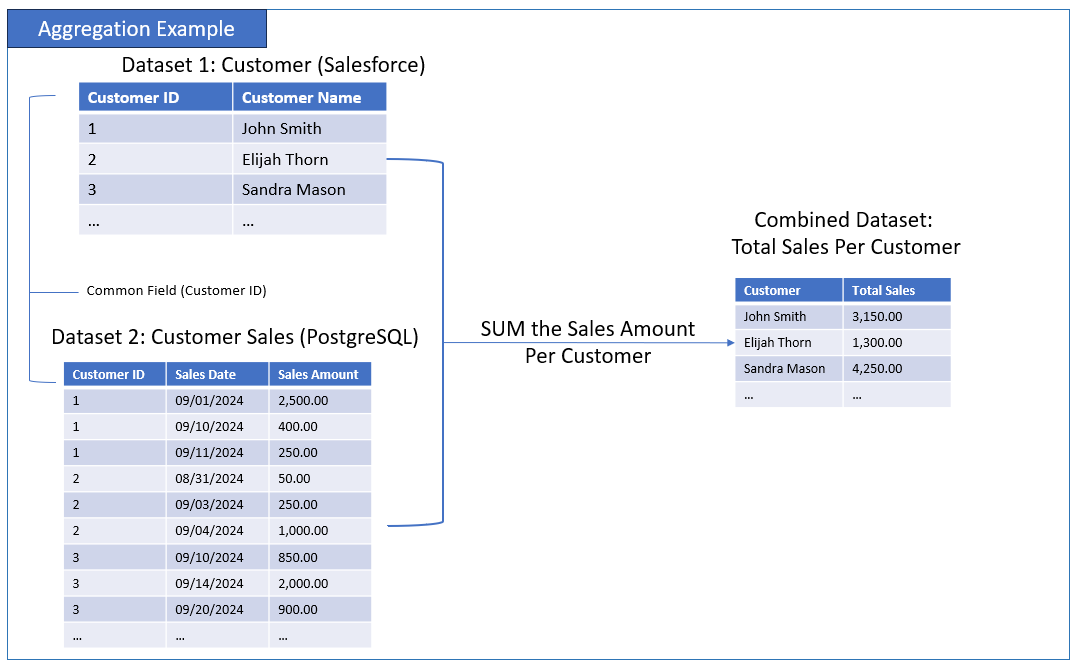
Operations like SUM, COUNT, or AVERAGE are the common types of aggregation.
For example, total sales per customer needs the SUM aggregation to summarize the data:
Light Data Transformations
Before blending, sometimes data needs light transformation, like changing data types or combining 2 or more columns. It ensures consistency and accuracy in blending datasets. This technique is common in Alteryx and tools with data preparation features.
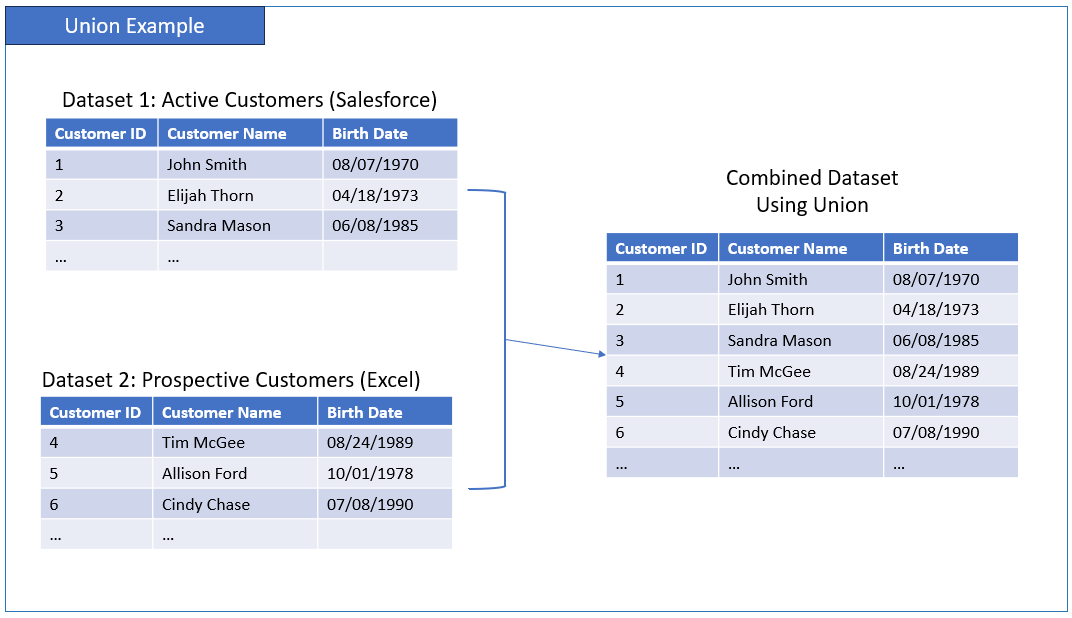
Unions
Sometimes, there is a need to combine data sources vertically. The result is additional rows instead of columns. This is used when datasets have the same number and type of columns but come from different sources or time periods.
Here's an illustrated example:
Data Blending vs. ETL
Both data blending and ETL combine data from various data sources. The movement and the number of steps taken differentiate the two. The following comparison illustrates the main differences before it reaches data visualization and analysis:
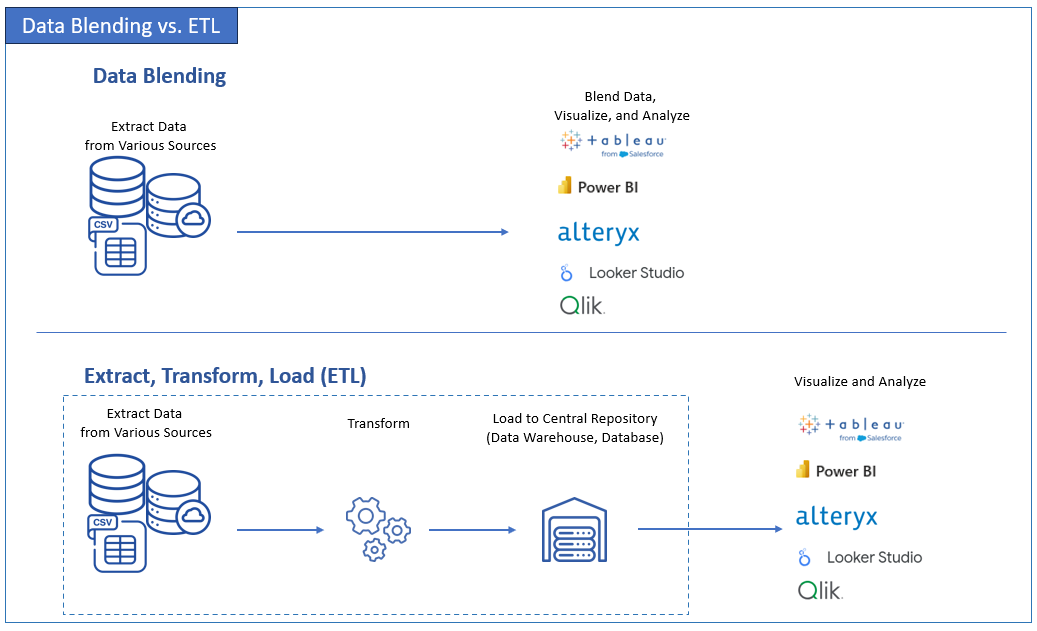
The visualization and analysis part may use any of the tools listed above.
The following is a table of differences for a detailed comparison:
| Aspect | Data blending | Extract, Transform, Load (ETL) |
|---|---|---|
| Purpose | Combine data from different sources for analysis | Extract, transform and load data into a unified storage |
| Data Movement | No data movement; Real-time access | Data is physically loaded into a centralized repository |
| Tools | Tableau, Power BI, Looker and Alteryx | Skyvia, Talend, Microsoft SSIS |
| Ease of Setup | Easy to set up in BI tools | Requires setup and configuration in an ETL tool |
| Flexibility | High; supports different data formats and sources in small and medium size data | Medium; good for large, structured datasets |
| Performance | Slower for large datasets | High performance after setup but resource-heavy |
| When to Use | For ad-hoc analysis of data from multiple sources | For large-scale, reccuring data integration into a warehouse or database |
Key Takeaways
- Data blending is best for quick, on-the-fly analysis of data from various sources without moving it.
- ETLis ideal for large-scale, centralized data integration into a warehouse, making it suitable for enterprise-level operations.
Use Cases Better Done in Data Blending Instead of ETL
Data blending is better than ETL when organizations need speed, flexibility, and real-time analysis across multiple data sources without the complexity of setting up a full integration pipeline. It shines in scenarios where datasets are small, temporary, or dynamic, or when resources are limited.
The following are some use cases and their examples:
Ad-Hoc Analysis Across Different Data Sources
- Scenario: A marketing team needs to analyze the impact of a campaign by blending customer demographics from a CRM system with campaign performance data from Google Analytics.
- Why Blending is Better: The team needs fast, real-time analysis. They can't wait for an ETL pipeline to be built.
Working with Small, Diverse Data Sets
- Scenario: A small business is comparing sales data from an internal SQL database with customer reviews stored in spreadsheets.
- Why Blending is Better: Setting up a full ETL process is overkill for the small amount of data. Instead, they can use a BI tool like Tableau to quickly see the connections between sales trends and customer feedback.
Time-Sensitive Dashboards
- Scenario: A project manager needs to create a dashboard combining project data from an internal time-tracking system with team performance data from a third-party tool.
- Why Blending is Better: The need is immediate and time-sensitive. Data blending can provide an up-to-date dashboard without waiting for an ETL process to move data into a data warehouse.
Temporary or One-Off Data Analysis
- Scenario: An analyst wants to blend financial data from an SQL database with an external Excel report for a one-time presentation to executives.
- Why Blending is Better: The analysis is temporary, so setting up an ETL pipeline would be unnecessary and time-consuming. Data blending offers a quick way to combine the two datasets for a one-off purpose without any long-term setup.
Combining External and Internal Data
- Scenario: A company needs to compare internal sales records with public weather data to see if weather patterns influence buying behavior.
- Why Blending is Better: The public weather data is external and doesn't need to be stored in the company's systems. Data blending allows them to pull this external data on the fly and combine it with internal sales data for quick insights.
Real-Time Reporting with Dynamic Data
- Scenario: A business wants to monitor social media mentions (from APIs) and compare them with internal customer support ticket data to identify emerging issues.
- Why Blending is Better: Social media data is always changing. So real-time, instant blending can better adapt to these changes.
Low Resources or Budget
- Scenario: A small startup wants to track website performance data from Google Analytics and sales from a SaaS platform. But they don't have the resources to build an ETL pipeline.
- Why Blending is Better: A small startup wants to track website performance data from Google Analytics and sales from a SaaS platform. But they don't have the resources to build an ETL pipeline.Data blending requires fewer resources and is cheaper to set up. It suits small companies or startups that need insights fast.
When Data Needs Are Constantly Changing
- Scenario: A product manager frequently pulls data from various systems (like a product database, customer feedback, and sales reports) for ever-changing analysis requirements.
- Why Blending is Better: Blending tools let them adapt quickly to shifting data needs rather than changing an ETL pipeline on every requirement change. As long as the data size is small and the blending speed is acceptable, this will serve them well.
Practical Applications of Data Blending
Listed are 8 practical uses of data blending in business along with an example:
- Analysis of marketing campaigns: Combining information from Google Analytics, social media, and CRM platforms to evaluate the success of campaigns.
- Sales and Reporting on Finance: Merging point-of-sale system sales data with ERP system financial data to make sales reports.
- Analysis of customer support services: Combining customer support ticket data with product usage data to discover trends in customer problems.
- Optimizing the Supply Chain: Monitor inventory levels and evaluate supplier performance by blending warehouse inventory data with supplier data.
- Health Care analysis: Merging patient records from hospital databases with external public health data to recognize patterns in patient outcomes.
- Segmentation of retail customers: Creating personalized marketing strategies by merging customers' purchase history from an internal database with external demographic data.
- Real estate investments analysis: Assess the effectiveness of real estate investments by combining external public property value data with internal financial data.
- Analytics in Human Resources: Using information from surveys measuring employee engagement, along with human resources data on performance and turnover, to evaluate employee satisfaction and address any concerns before turnover becomes a significant problem.
Emerging Trends and Technologies Affecting Data Blending
The following are the most notable trends and technologies shaping the future of data blending:
AI-Driven Data Blending
Mapping of dataset relationships is becoming easier than ever. Artificial Intelligence (AI) and Machine Learning (ML) can find out these relationships. This makes data matching more accurate and reduces reliance on skilled IT staff.
Impact: AI-driven tools can make data preparation and blending easier. It can even suggest optimal blending models to improve both speed and precision.
Self-Service Analytics
There is increasing demand for self-service analytics platforms. Tools like Tableau, Power BI, and Alteryx are easy to use, making it simpler to analyze data without a technical background.
Impact: More and more non-technical users can access and blend data from multiple sources, reducing reliance on IT departments.
Data Virtualization
Data virtualization tools can help with real-time data blending. It creates a virtual layer where data can be accessed, queried, and blended across sources. This further reduces the need for a data warehouse.
Impact: This trend speeds up the blending process by removing data duplication and movement. So data blending becomes faster and more efficient for real-time data analysis.
Data Governance and Compliance
Data blending tools are evolving to provide stronger governance frameworks to meet increasing compliance regulations. Ensuring that blended datasets meet compliance standards is critical.
Impact: Modern tools are integrating robust data governance, auditing, and security features, allowing companies to blend sensitive data while staying compliant.
Edge Computing
The rise of edge computing is driving the need for blending data at the edge. This means blending data closer to where it is generated. This is very important for manufacturing and healthcare industries that collect data from IoT devices.
Impact: Tools that blend data at the edge reduce latency and run faster. This also results in faster decision-making.
Augmented Analytics
Augmented analytics help prepare, blend, and visualize data by using AI. So, it's not just data blending. It's a complete analytics package. Tools like Qlik Sense and Tableau have features like these. They suggest the best ways to blend and visualize data.
Impact: These tools make data blending more accessible to non-experts. They automatically recommend the most effective data combinations and visualizations.
Natural Language Processing (NLP) in Data Blending
NLP is being combined into data analytics tools. This lets users ask questions and blend data using conversational language. Non-technical users can enjoy “conversing” with their tool and the tool will blend their data.
Impact: Tools like Power BI Q&A use NLP to let users interact with datasets and generate blended reports without needing to write complex queries.
Conclusion
In summary, data blending combines data from various sources into a single, unified dataset. It needs a primary and secondary source. Similar to ETL, it combines data from different sources, but without the need to store the dataset in a data warehouse.
BI Tools like Tableau and Power BI make data blending easy with visual design and AI integration. But once a business grows further and data becomes larger by the day, there is a need for a reliable data integration tool like Skyvia to combine the data. The same BI tools can be used to visualize and do data analysis later.